
Investment Insights
Flows set the price, the narrative set the flows
Joydeb Chatterjee, CFA, Executive Director - Investment Advisory and Fixed Income Selections, Lighthouse Canton

Table of Contents
US Treasuries: anatomy of the October retracement
Were net institutional flows the driver, and what changed behind the scenes?
Bottom line
MARKET VIEW
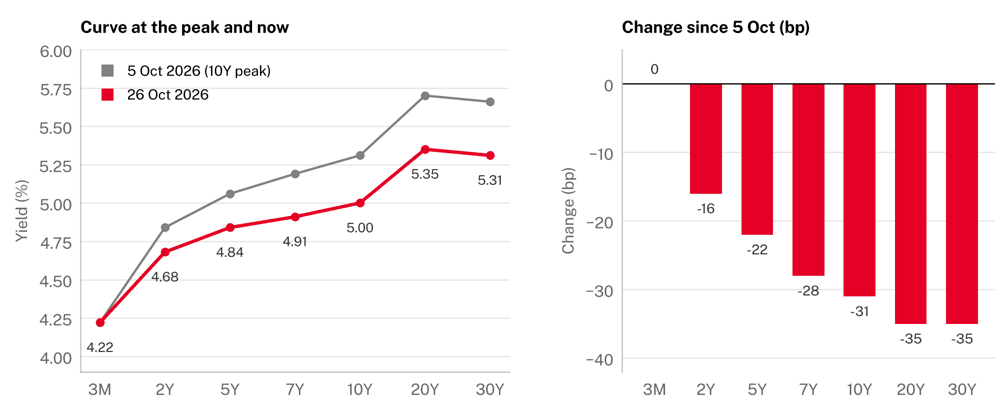
• The move. The 10Y fell 31bp from its 5 October closing high of 5.31%, the highest close since 2002, to 5.00%. The 30Y fell 35bp to 5.31%, and 3M bills did not move. The 2s10s curve flattened from 47bp to 32bp.
• Real yields did the work; inflation expectations barely moved. The 10Y TIPS real yield fell 29bp while 10Y breakevens fell only 2bp. That happened even though September CPI came in at 3.7% and Brent rose to its highest close since April.
• On flows: yes, with a qualification. About three quarters of the 31bp ran through positioning, haven reallocation and real-money buying. Record real-money inflows, however, arrived while yields were still rising. They set a floor, and the turn came when the marginal flow changed sign.
• What changed behind the scenes. AI capex doubts turned an inflation scare into a growth scare; crowded futures shorts covered; 5%+ yields reached liability-driven buy levels; hyperscaler issuance paused and talk of refunding cuts grew; the Fed signalled patience.
• What did not change. No Fed duration buying, continued Japanese and Chinese official selling, unchanged deficits and 3.7% inflation. Base case: 10Y at 4.85–5.15% into year-end.
PORTFOLIO POSITIONING
Neutral duration with a bias to add on weakness, overweight the 5–10Y belly against the 20–30Y long end into the 4 November refunding, and a modest preference for TIPS for new duration. Latest close (27 October): 10Y 4.99%, 30Y 5.30%.
• Duration. Do not chase the rally; the positioning-driven move is largely done. Add in steps on a back-up to 5.20–5.30% on the 10Y, where real money has bought; trim at 4.85–4.90% or below. A breakeven above 2.45% or renewed asset-manager shorting would argue for an underweight.
• Curve. The 20–30Y sector has rallied the most (−35bp), partly on hopes of supply cuts at the 4 November refunding and carries the most risk if they are not delivered. Prefer 5–10Y to the long end into the announcement. Any 20Y cut is better played as relative value against the 10Y than as an outright long.
• Inflation and front end. A 10Y breakeven near 2.35% looks low with CPI at 3.7% and Brent above $110, so part of any new duration can go into TIPS. Keep liquidity in bills, which are anchored at the 3.75–4.00% policy range, with a December hike largely priced.
• Hedging and credit. Treasuries again partly offset equity and credit risk, though 3.7% inflation makes the hedge less reliable. The pause in hyperscaler issuance supports long-end IG in the near term; stay selective in AI-infrastructure credit.
• Triggers to revisit. The 28 October FOMC, the 4 November refunding and the 10 and 12 November auctions. An indirect share above 70% with continued long-duration inflows would support a modest overweight.
1. The move in numbers
The Treasury market made a sharp round trip. The 10Y rose from 5.00% to 5.31% in the nine sessions to 5 October, then gave all of it back by 23 October. The retracement came in three steps. First, strong 10Y and 30Y auctions on 7 and 8 October. Second, a global bond rally on 15 October, when semiconductor stocks fell and Treasuries held their gains despite hot CPI and PPI prints. Third, the 22 October session, when the 10Y par yield fell 17bp, its biggest one-day drop since the regional-bank stress of March 2023, on a Meta-led sell-off in AI stocks.
FIGURE 1
UST yields, 1 July to 26 October 2026
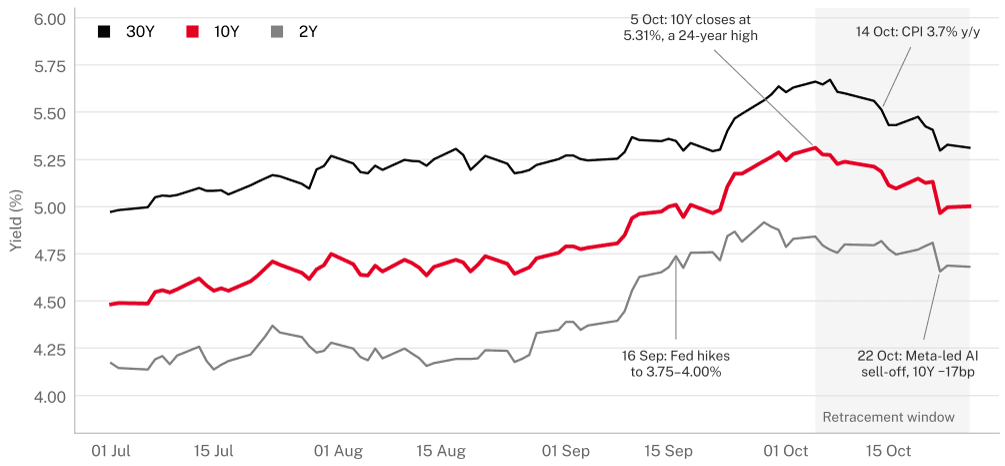
Source: US Treasury daily par yield curve, closing par yields. Shaded area marks the retracement window.
TABLE 1
Treasury par yields, peak versus latest
Tenor | 5 Oct 2026 (%) | 26 Oct 2026 (%) | Change (bp) |
|---|---|---|---|
3M bill | 4.22 | 4.22 | 0 |
2Y | 4.84 | 4.68 | −16 |
5Y | 5.06 | 4.84 | −22 |
7Y | 5.19 | 4.91 | −28 |
10Y | 5.31 | 5.00 | −31 |
20Y | 5.70 | 5.35 | −35 |
30Y (peak 5.67% on 7 Oct) | 5.66 | 5.31 | −35 |
10Y TIPS real yield | 2.95 | 2.66 | −29 |
10Y breakeven (nominal less real) | 2.36 | 2.34 | −2 |
2s10s curve (bp) | 47 | 32 | −15 |
Source: US Treasury daily par nominal and real yield curves.
FIGURE 2
A bull flattener led by the 5Y–30Y sector; bills unchanged
Source: US Treasury daily par yield curve.
The shape of the move is telling. Bills were pinned by the policy rate (3.75–4.00%) and by close to $8tn of money-market fund cash, so the belly and long end did the work. A bull flattener straight after a Fed hike, with inflation still rising, usually means the market thinks policy is tight enough to slow growth and is buying duration ahead of that, rather than pricing faster inflation.
2. Decomposing the retracement
We split the 10Y move two ways, using official Treasury curves only. The real/breakeven split shows that inflation compensation did almost nothing (−2bp), which stands out given that Brent closed at $116.72 on 23 October and September PPI rose 1.3% m/m. The front/back split uses the 2Y as a rough proxy for the expected policy path. It assigns −16bp to the policy path and −15bp to a term component, which captures term premium, supply expectations and flow effects.
FIGURE 3
The rally was a real-yield event rather than an inflation-expectations event
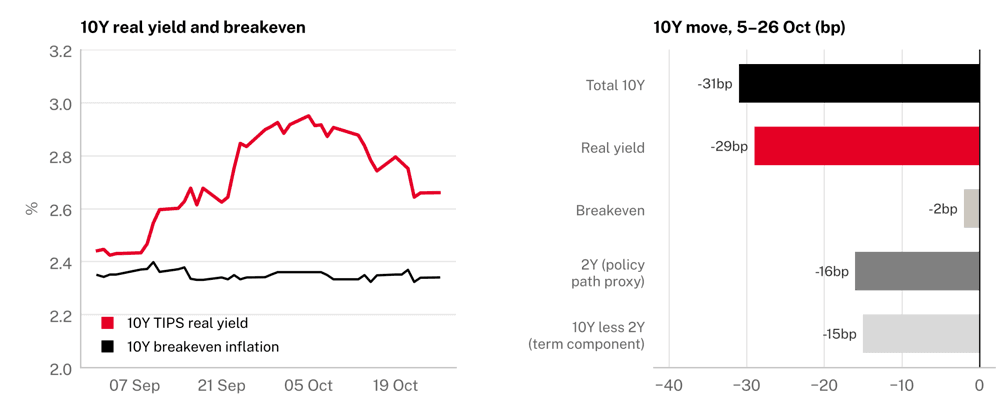
Source: US Treasury par nominal and real yield curves; breakeven equals nominal minus real. The term component is a simple 10Y minus 2Y residual, not a model term premium.
Interpretation. This is the pattern investors produce when they buy duration for safety and income at an unchanged inflation outlook. A market re-rating inflation would have moved breakevens instead. That points the analysis to flows, positioning and the term premium, which is why the flow question is the right one to ask.
3. Factors behind the retracement
The table below gives our judgmental attribution of the 31bp decline in the 10Y between 5 and 26 October. The ranges are indicative. They are built from the timing of each move, the curve and real/breakeven splits, and the flow evidence in Section 4, and they are not model outputs.
TABLE 2
Judgmental attribution of the 10Y retracement
Driver | Indicative 10Y impact | Key evidence | Durability |
|---|---|---|---|
AI capex growth scare and haven reallocation | −10 to −12bp | SOX fell almost 20% from 1 to 15 Oct; Nasdaq 100 −5.5% in the week of the first 17bp drop; Meta −7% on 22 Oct; CoreWeave debt yields up from 9% to 15%; global bond rally on 15 Oct | Medium |
Positioning unwind (short covering) | −7 to −9bp | Asset managers added more than 100k 10Y futures shorts in the week to 22 Sep; speculative 10Y net short near 1mn contracts; CTAs exited “extremely short” positions in mid-October | Low (one-off) |
Real-money buying at the valuation threshold | −4 to −6bp | 10Y auction bid-to-cover 2.77 with a record-low 2.5% dealer take-down; record EPFR inflows into US government bond funds in Q3; asset-manager demand for long-dated Treasuries above average | High (acts as a floor) |
Fed-path repricing | −4 to −6bp | Williams and Jefferson priced out an October hike; market odds of an October pause rose from 36% to about 90% over the month; December hike still about 75–80% priced | Medium |
Supply relief (corporate and Treasury) | −4 to −6bp | Hyperscalers front-loaded issuance and are holding large cash balances; Citi base case of $3bn cuts to 20Y and 30Y auctions; BofA client feedback put supply-cut odds at 35–40% | Low (binary on 4 Nov) |
Offset: oil and inflation | +2 to +4bp | September CPI 3.7% y/y (core 2.6%); PPI +1.3% m/m; Brent near $115–117 | Ongoing headwind |
Net (observed) | −31bp | 5.31% to 5.00% |
Ranges are indicative and not additive to a precise total.
Three of the five downward drivers act through flows: haven reallocation, short covering and real-money buying. Together they account for roughly 21–27bp of the 31bp. The other two, Fed-path repricing and supply expectations, are about expectations, but they too reached prices through futures and cash trading.
4. Net institutional flows: the evidence
FIGURE 4
Institutional flow scorecard: strong into the peak, fading into the rally
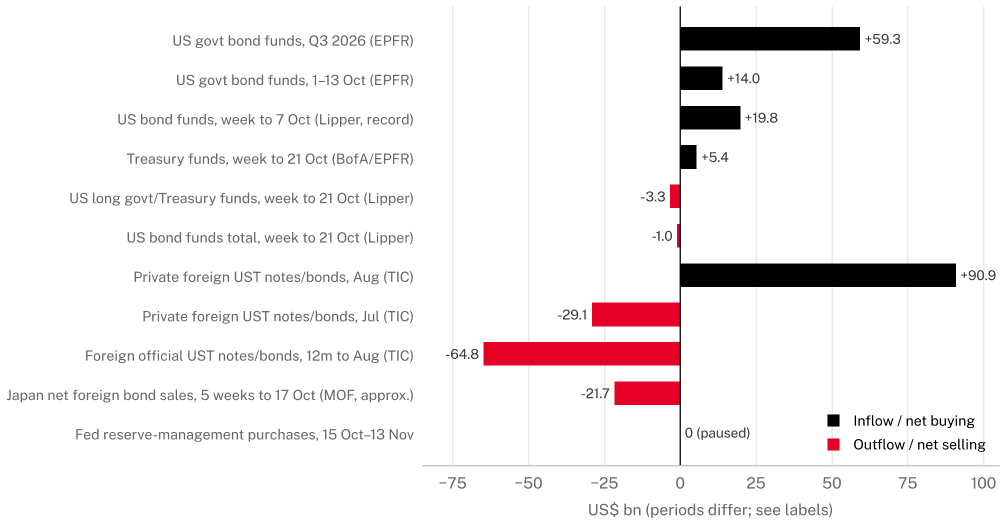
Sources: EPFR via FT and BofA; LSEG Lipper via Reuters; US Treasury TIC; Japan MOF (yen converted at approximately JPY 158 per USD); New York Fed. Periods differ and are not additive.
4.1 Real-money funds and ETFs
Demand from real-money funds was exceptionally strong into the yield peak. On EPFR data, US government bond funds took a record $59.3bn in Q3 and roughly another $14bn in early October. LSEG Lipper recorded a weekly record of $19.78bn into US bond funds in the week to 7 October, including $6.76bn into short/intermediate government and Treasury funds. ICI estimated $24.56bn of bond-fund inflows that week. State Street's asset-manager flow data show Q3 demand for 3–7Y Treasuries in the top quartile of the past five years. They also show demand for long-dated Treasuries above its historical average for the first time since September 2024.
Timing matters here. In the week to 21 October, which ended the day before the biggest rally session, US bond funds had a net outflow of $969m on Lipper data. That ended a 26-week inflow streak, and $3.3bn left longer-dated government and Treasury funds. A broader EPFR measure (BofA) still showed $5.4bn into Treasury funds that week, and TLT took about $1.14bn over the month. Overall, real-money fund flows built up while yields were rising and were fading by the time the rally peaked. They did not drive the final leg.
4.2 Auctions and end-investor demand
FIGURE 5
6–8 October auctions: end-investors absorbed duration at the highs
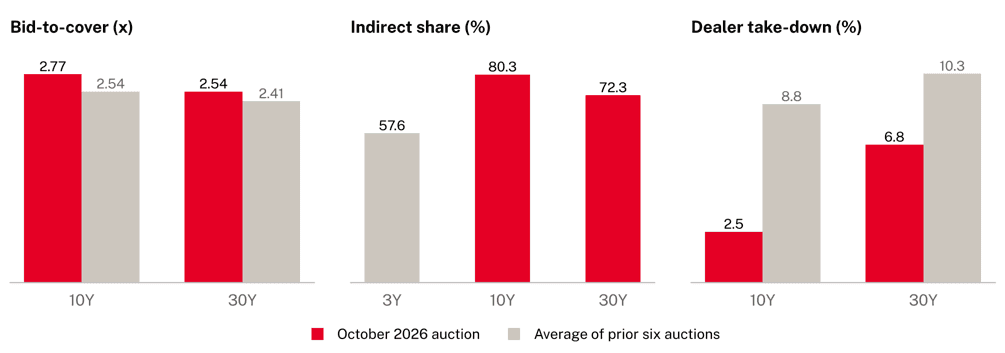
Source: US Treasury auction results (3Y 6 Oct, 10Y 7 Oct, 30Y 8 Oct 2026). The 10Y dealer share was a record low for the tenor.
The 6–8 October auctions were the turning signal. The $39bn 10Y reopening stopped 1.7bp through the when-issued level at 5.300%. Its bid-to-cover of 2.77 was the highest of the last 50 auctions, and dealers kept only 2.5%, a record low for the tenor. The 30Y cleared at 5.618%, with indirect bidders taking 72.3% against a 10-auction average of 68%. Indirect bidders took only 57.6% of the 3Y. End-investors wanted duration above 5% rather than short notes, and with dealers holding almost nothing after the auctions, the bond shorts were exposed.
4.3 Foreign investors: private in, official out
FIGURE 6
Official Asia out, private custody centres in
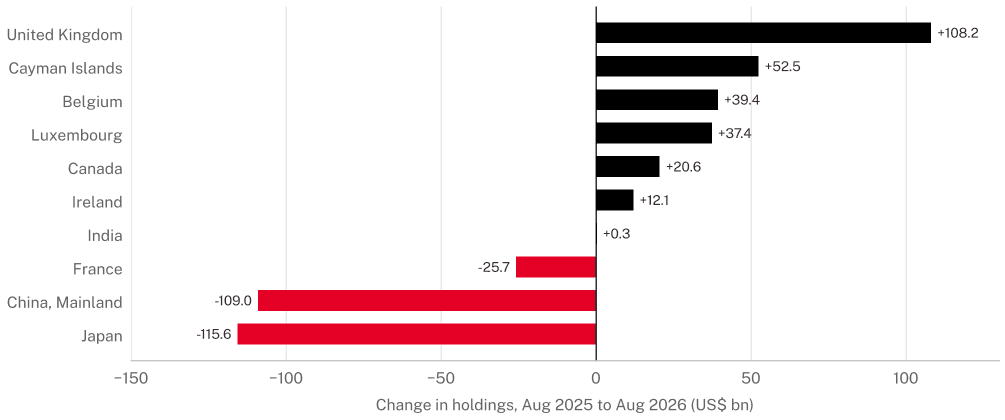
Source: US Treasury TIC Table 5 (Major Foreign Holders). Total foreign holdings +$82.6bn to $9,331.7bn; foreign official notes and bonds −$64.8bn.
The latest TIC data (August) show total foreign holdings up $83.3bn to $9.33tn. Private foreign investors bought $90.9bn of notes and bonds after selling $29.1bn in July. The buying came through custody centres: the UK went above $1tn for the first time, and Canada and Belgium also added. The official sector moved the other way. Japan cut $35.6bn to $1,068.3bn, the lowest since December 2024, after a record ¥15.4tn yen intervention. China cut $27.3bn to $590.7bn, the lowest since 2008. Foreign official holdings of notes and bonds are $64.8bn lower than a year ago.
Higher-frequency Japanese data confirm the pattern. Japanese investors were net sellers of foreign bonds for five straight weeks to 17 October, about ¥3.43tn in total. That is the longest selling streak in four years, and it lifts year-to-date sales to ¥5.18tn. Domestic banks led the selling. With 10Y JGB yields above 3% and 30Y near 4%, JGBs now yield more than FX-hedged Treasuries. The pace of selling slowed as Treasury yields fell, but Japan was not a buyer behind the rally.
4.4 Leveraged and systematic accounts
Positioning gave the rally its speed. Asset managers added more than 100,000 contracts of 10Y shorts in the week to 22 September, one of the largest weekly increases since 2023. Speculative net shorts in 10Y futures stood at 988,102 contracts on 13 October and 964,293 on 20 October. Trend-following CTAs had built “extremely short” positions and exited them in mid-October. One caveat: the large leveraged-fund short in CFTC data (about 2.1mn 10Y contracts on 20 October, against an asset-manager net long of about 2.9mn) mostly mirrors cash-futures basis trades and is not a directional bet. Morgan Stanley estimates the basis trade has shrunk about 20% this year to around $1.2tn, so a forced basis unwind was not the mechanism here.
4.5 Official sector and the front end
The Fed did not drive the move. The New York Fed Desk planned about $14.6bn of reinvestment purchases and no reserve-management purchases for 15 October to 13 November. Money-market funds hold $7.94tn, near their $7.98tn record, and stablecoin issuers hold close to $200bn of bills and other short-dated Treasuries. These buyers keep the bill curve anchored, which is why 3M yields did not move, but they add no duration demand. Treasury's enlarged long-end buybacks ($6bn per operation in the 10–20Y and 20–30Y buckets in October) help liquidity. They are funded by new issuance, however, so they do not cut net supply.
TABLE 3
Flow scorecard by investor type
Investor group | Direction (Sep–Oct) | Role in the retracement |
|---|---|---|
Real-money funds and ETFs | Strong inflows to early Oct; long-duration funds in outflow in the week to 21 Oct | Supporting: built the floor at 5%+ |
Auction end-investors (indirect) | Heavy demand for 10Y and 30Y at 5.3–5.6% | Catalyst: exposed the shorts |
CTAs and tactical asset-manager shorts | From adding shorts to covering | Primary: amplified the speed |
Cross-asset (equity to bonds) reallocation | Haven buying on AI sell-off days | Primary: triggered the largest moves |
Foreign private (UK, Canada, Belgium, Cayman) | Net buyers (August TIC) | Supporting |
Foreign official (Japan, China) | Net sellers | Headwind |
Federal Reserve | No reserve-management purchases scheduled | Neutral |
Money-market funds and stablecoins | Bill demand only | Neutral for duration |
Sources: as for Figure 4 and Sections 4.1 to 4.5.
5. Were flows the primary driver?
Yes, as the transmission mechanism; no, as the root cause. We tested the flow hypothesis three ways.
Price versus quantity. If buying volume alone drove yields, the record Q3 inflows would have pushed yields down. Instead, the 10Y rose almost 70bp from mid-August to early October while those inflows came in. Real-money demand absorbed supply; it did not set the direction.
Timing. The biggest down-moves (15 and 22 October) came on AI-led equity sell-off days and during short covering. They did not line up with the peak weeks for fund inflows, and the long-duration fund series was negative in the week before the largest move.
Shape. Real yields fell, breakevens stayed flat and the curve bull-flattened. That is how haven and duration demand look when combined with a lower growth outlook; a shift in inflation expectations would have shown up in breakevens.
Our conclusion: flows set the price, and the narrative set the flows. What mattered was less the volume of money going into Treasuries than which buyers sat at the margin and which way they were trading. In September the marginal flow was fast money selling duration short against steady real-money buying. In October it was fast money buying back those shorts and equity investors seeking a haven, while competing supply stepped back.
6. What changed behind the scenes
FIGURE 7
Transmission map: from catalysts to flows to yields
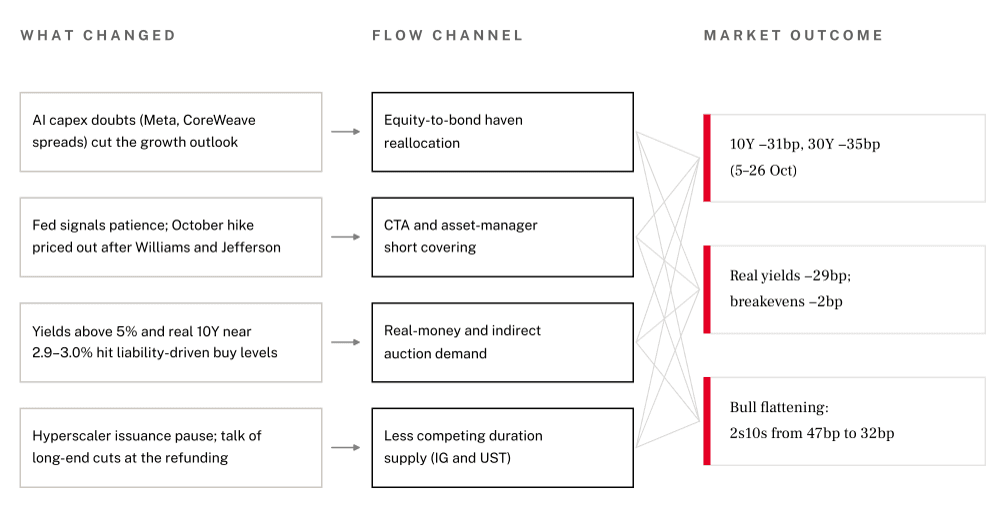
Not in the chain: the Fed balance sheet (no reserve-management purchases scheduled 15 Oct to 13 Nov) and foreign official buyers (Japan and China were net sellers).
6.1 The AI growth engine was questioned
AI capex has been a main engine of US growth. In October investors began to doubt that the build-out could be financed at any price. Meta lifted the bottom of its capex guidance to $135–145bn, said it would issue non-voting shares to help fund AI expansion, and its credit risk hit a record. CoreWeave debt yields went from 9% to 15%. Markets read slower AI spending as slower GDP growth. That brought back the negative stock-bond correlation that had been missing for most of the sell-off, and Treasuries worked as a haven again even with oil above $110.
6.2 Positioning became one-sided
Seven months of rising yields drew in trend-following and tactical shorts. Once the 7–8 October auctions showed solid real-money demand above 5%, the risk/reward for shorts turned against them and the covering fed on itself. This part of the rally is mostly finished: CTA shorts have been cut, and the remaining large leveraged shorts are basis hedges rather than directional positions.
6.3 Valuation reached liability-driven buy levels
A 10Y real yield near 2.9–3.0% and nominal long-end yields of 5.6–5.7% were enough for pension funds, insurers and foreign private accounts to buy. The auction data show it: a record-low dealer take-down, an indirect share near record and strong stop-throughs. This demand is price-sensitive. It is likely to return if yields go back to 5.20–5.30%, but it will not chase yields lower.
6.4 Competing supply stepped back
Hyperscaler bond issuance had been drawing long-duration demand away from Treasuries, especially from pension funds. After front-loading in 2025–26, ten large AI-linked companies now hold about $775bn of cash and securities, plus about $108bn raised since their last quarter-end. They can fund near-term capex without returning to the bond market, and SpaceX is moving to the loan market. On the Treasury side, the August refunding changed the guidance language from “increases” to “changes”. The dealer survey on 16 October revived talk of cuts to 20Y and 30Y auction sizes at the 4 November refunding, and the long end outperformed the following session.
6.5 The Fed's reaction function
After the 16 September hike to 3.75–4.00%, Williams and Jefferson signalled patience, and the market dropped an October hike from its pricing. Payrolls rose only 29k in September, with unemployment at 4.2%, and housing data were weak. The market now reads the Fed as tightening into a slowdown caused by an energy supply shock. On that reading a growth policy error is a bigger risk than runaway inflation, so investors buy the long end and the curve flattens.
6.6 What did not change
• Fiscal supply. The Treasury still sells about $2.2tn a year in net new debt. Any long-end cut would be offset with more bills, not less borrowing.
• The official sector. The Fed is not buying duration. Japan and China are still reducing holdings, and Japan has a structural reason to repatriate.
• Inflation. CPI is 3.7%, core 2.6%, and the Middle East supply risk is unresolved. Strait of Hormuz flows are about 26% below pre-war levels.
• Global term premium. French 10Y OATs went above 5% for the first time since 2002 on 21 October. Sovereign fiscal stress is a shared, global influence on term premia.
7. Catalysts and scenarios
TABLE 4
Near-term catalyst calendar
Date | Event | What to watch |
|---|---|---|
28 Oct | FOMC decision and press conference | Hold at 3.75–4.00% expected; guidance on December; any hawkish dissents |
30 Oct | TIC annual survey (final) | Revisions to foreign holdings |
3 Nov | US midterm elections | Fiscal outlook; reported plans for renewed Iran operations after the vote |
4 Nov | Quarterly refunding announcement | Changes to 20Y/30Y sizes, bill share, buyback scale, any new SOFR floating-rate note |
10 / 12 Nov | 10Y and 30Y auctions | Indirect share and dealer take-down compared with October |
Weekly | Lipper/EPFR, CFTC, Japan MOF flows | Long-duration fund flows; asset-manager shorts; Japanese net selling |
8–9 Dec | FOMC with new projections | The December hike (75–80% priced) and the dots |
Dates are for 2026 and subject to change.
TABLE 5
Illustrative house scenarios
Scenario | Year-end 10Y | Probability | Conditions |
|---|---|---|---|
Bull | 4.60–4.80% | 30% | AI capex retrenchment widens; refunding cuts long-end sizes; Iran talks ease oil; Fed hikes once and signals the end of hikes |
Base | 4.85–5.15% | 45% | Refunding gives guidance but no immediate cuts; December hike delivered; real money buys above 5.15%, fast money cut back |
Bear | 5.25–5.50% | 25% | No change at refunding; oil spikes on renewed strikes; hyperscaler issuance returns; Japanese repatriation speeds up |
Probabilities are subjective.
Disclaimer: Lighthouse Canton Pte Ltd. (“LCPL”) is incorporated in the Republic of Singapore (Registration No: 201422117K) and regulated by the Monetary Authority of Singapore (Capital Markets Services Licence No. CMS100443). Lighthouse Canton Capital (DIFC) Pte Ltd (“LCC”) is incorporated in Dubai International Financial Centre (Licence No. CL 2614) and regulated by Dubai Financial Services Authority (Category 3C Licence No. F004068). The financial products offered by LCPL and LCC are only available to Accredited Investors and Institutional Investors as defined by MAS and Professional Investors as defined by DFSA. The information in this electronic transmission does not constitute an offer, or intention by, or on behalf of LCPL and/or LCC, to subscribe, purchase or sell any financial products and/or services. LCPL and LCC accept no liability for any loss arising from the use of any information contained herein. The contents of this email are confidential and meant for the intended recipient only.