
Investment Insights
Momentum, interrupted | Market commentary
Devansh Bhatt, Investments & Products

Table of Contents
Market commentary: the momentum trade’s October unwind, and what two LC systematic strategies tell us about it
For most of the past year, buying what had gone up worked. Momentum portfolios rode a narrow, AI-led market, and as late as September US momentum ETFs were comfortably beating the S&P 500. In October the trade unwound. From 6 to 22 October two leading US momentum ETFs fell 9–11%, while the S&P 500 slipped less than 2% and the equal-weighted S&P 500 rose. The losses came from a change in leadership, not a broad market sell-off.
Summary
◆ LC Momentum Index: ahead of its peers but underperformed S&P through a difficult October. The index is −7.4% since its 13 August launch, against −9.1% for SPMO and −8.2% for MTUM. It gained 4.2% in September as semiconductor leadership persisted, gave that back as the trade unwound in October, and cushioned the fall by rotating into refiners, which added 2.8 points to October’s return. SPY has returned -2.1% over the same period.
◆ LC Systematic Global Equities: closer to the semiconductor trade. The fund tracked global equities through September and was about 4% above its July launch level on 2 October. Its 1 October rebalance made semiconductors its largest position just as the rotation began and, with no energy exposure in its universe, it had no offset; it is −2.7% since launch. The fund is down approximately -4.5% in Oct vs. -1.2% for ACWI.
◆ A change in leadership, not a market sell-off. In October to the 23rd semiconductors fell 13% and energy rose 13%, while the S&P 500 was flat and the equal-weighted S&P 500 gained 4%. A Fed hike, 5% Treasury yields, hot inflation and doubts about how AI spending is financed turned investors away from the year’s winners.
◆ Crowding made the unwind fast. Long semiconductors was the most crowded trade in BofA’s fund manager survey for four months running, and momentum’s correlation with semiconductors peaked at 0.95. Hedge funds cut technology at the fastest pace in Goldman Sachs’ records, and on 22 October long/short and multi-strategy funds all lost more than 1% on the same day for the first time since Covid.
◆ Outlook: a factor in transition. Momentum signals are moving away from AI hardware: at unchanged prices, energy overtakes semiconductors as the strongest sector within two months. Positioning is lighter after the selling, but momentum remains closely tied to semiconductors, which makes November’s chip earnings the key near-term test.
◆ The hedges favor a slow decline over a sharp rebound. In a sustained bear market, the strategies’ cash overlay and the shift towards energy and defensive sectors have historically limited losses. In a V-shaped recovery led by October’s losers, the strategies would likely lag at first, until their signals catch up.
A crowded winner
Going into the autumn, momentum and the AI hardware trade were close to the same thing. The past year’s strongest stocks were concentrated in semiconductors, chip equipment, memory and storage, so any portfolio ranked on past returns held plenty of them. Our LC Momentum Index, which holds the 30 strongest S&P 500 names, was about half technology.
September showed how narrow the market had become. SPMO rose 3.2% and MTUM 5.9%, while the S&P 500 was flat and the equal-weighted index fell 4.8%. By mid-October the median S&P 500 stock was up less than 5% for the year. Meanwhile, rates turned against long-duration winners. The Federal Reserve raised rates by 25 bp to 3.75–4.00% on 16 September, its first hike since 2023, and the 10-year Treasury yield closed above 5.1% on 23 September, the highest since 2007.
October: the unwind
The sell-off in AI hardware came in waves:
◆ 2 October: Toshiba’s plan to double hard-disk output hit storage names.
◆ 12–13 October: China’s CXMT disclosed advanced DRAM progress, and Broadcom’s chief executive likened some AI investors to gamblers.
◆ 14–16 October: September CPI came in at 3.7%, and the Philadelphia Semiconductor Index fell for eight straight sessions, its longest losing run since 2008. Strong TSMC and ASML results did not stop it, as investors focused on how debt-funded AI infrastructure would be financed.
◆ 22 October: Lam Research said supply constraints would cap its guidance into 2027. The semiconductor index fell 6.7%, with all 30 members lower.
Meanwhile an oil and refined-product squeeze, from Hormuz disruption and strikes on Russian refineries, pushed US refining margins to records and WTI to about $101. In the week to 16 October technology fell about 8% while consumer staples and energy each gained about 5%. The sell-off was global: Korea’s memory-heavy Kospi fell 7.6% on 15 October.
Figure 1 · Momentum’s round trip: index levels since 13 Aug 2026 (= 100)
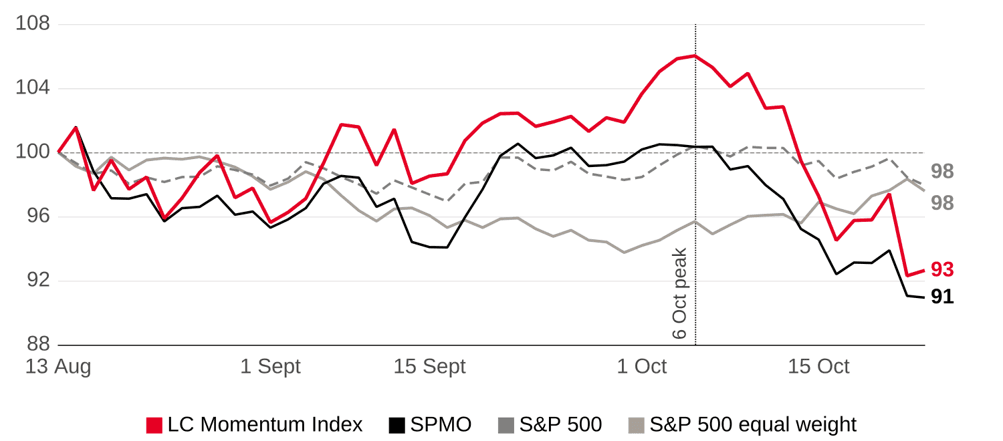
LC Momentum Index (net of fees) vs Invesco S&P 500 Momentum ETF (SPMO), S&P 500 (SPY) and S&P 500 Equal Weight (RSP), total return. Sources: Lighthouse Canton, Yahoo Finance.
Figure 2 · October’s rotation: semiconductors down, energy up (30 Sep 2026 = 100)
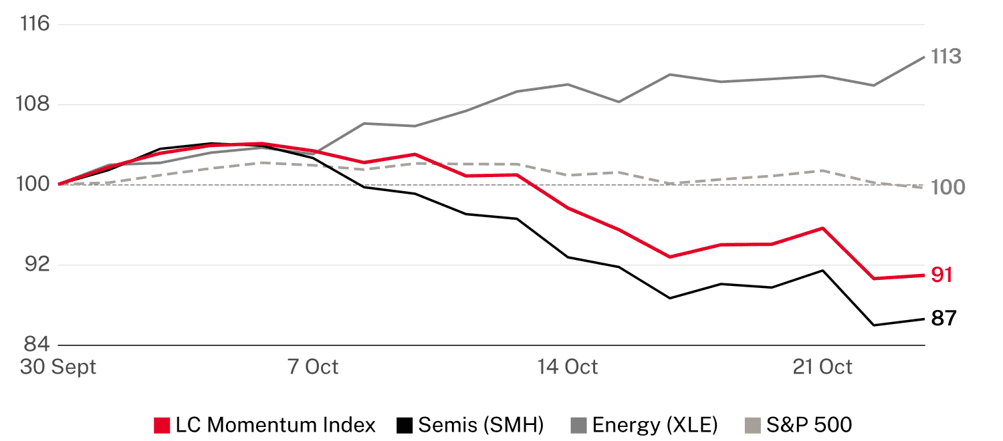
LC Momentum Index (net) vs VanEck Semiconductor ETF (SMH), Energy Select Sector SPDR (XLE) and S&P 500 (SPY), total return. Sources: Lighthouse Canton, Yahoo Finance.
Why momentum moves this way
Momentum ranks stocks on past returns, so the portfolio concentrates in whatever has been leading. When leadership is a single theme, the factor becomes a bet on that theme. Academic work on “momentum crashes” finds its sharpest drawdowns tend to come in such reversals, not in broad bear markets.
The LC Momentum Index illustrates the mechanics: semiconductor and energy ETFs together explain about three-quarters of its daily variation, and its market sensitivity is high by design. That amplified both September’s gains and October’s pullback.
Crowding: one trade, many holders
The reversal was sharp because so many investors held the same trade. Long global semiconductors was the most crowded trade in BofA’s Global Fund Manager Survey four months running. It was named by a record 82% of respondents in July and still 45% in October, when a net 37% of managers were overweight technology, the most since August 2020. Hedge fund books told the same story: technology was still 23.5% of Goldman Sachs’ prime-brokerage book in mid-October, in the 90th percentile of the past five years, even after heavy selling.
Our own data show the factor converging on that trade. The three-month correlation between momentum’s excess return (SPMO vs SPY) and semiconductors’ (SMH vs SPY) rose from about 0.5 in March to 0.95 in early August, and was still 0.90 on 23 October. For practical purposes, owning momentum meant owning the semiconductor trade.
When that trade turned, the selling was concentrated and fast. According to Goldman Sachs Prime Brokerage:
◆ Fastest tech cut on record: in the week to 15 October hedge funds cut technology exposure at the fastest pace since its records began in 2016. Global equities were net sold at two standard deviations above the past year’s average, and net leverage fell to a one-year low of 48.6%.
◆ An industry-wide bad day on 22 October: fundamental long/short, systematic long/short and multi-strategy funds all lost more than 1% on the same day for the first time since the Covid sell-off, and more than two-thirds of funds finished lower.
◆ Asia hit hardest: Asia-focused stock pickers fell 6.8% in the first half of October. Korea’s market entered bear territory, with SK Hynix down about 26% and Samsung about 22% over five sessions to 15 October.
Breadth confirms an unwind rather than a sell-off: on 22 October the S&P 500 fell 1.2% while 337 of its 497 members rose. Against their own past year, the momentum and semiconductor spreads moved 2.5–2.8 standard deviations on the worst days (table below). That is large, but comparable to the same trades’ unwind in late July.
Relative performance | October to 23rd | Largest daily move | Largest 5-day move |
Momentum vs equal weight (SPMO vs RSP) | −12.1% | −2.7σ (22 Oct) | −2.4σ (wk to 16 Oct) |
Momentum vs low vol (MTUM vs USMV) | −13.7% | −2.8σ (22 Oct) | −2.5σ (wk to 16 Oct) |
Semiconductors vs S&P 500 (SMH vs SPY) | −13.1% | −2.5σ (22 Oct) | −2.1σ (wk to 14 Oct) |
Energy vs S&P 500 (XLE vs SPY) | +13.1% | +2.1σ (16 Oct) | +1.9σ (wk to 14 Oct) |
Return of the first ETF relative to the second (difference in daily log returns). Source: Lighthouse Canton; Yahoo Finance.
Two strategies, two speeds
LC Momentum Index: The index participated fully in September’s leadership, gaining 4.2% and reaching 6% above its launch level by 6 October. Its October pullback reflected that same semiconductor exposure: chip, equipment and storage names accounted for about 7.5 points of the month’s return. Weekly rebalancing then did what it is designed to do: as refiners’ momentum built, the index added Valero, Marathon, Phillips 66, Targa and APA, lifting energy from about 10% to 27% of the portfolio. Those positions contributed +2.8 points in October and are the main reason the index is ahead of both momentum ETFs since launch: −7.4%, against −9.1% for SPMO and −8.2% for MTUM. Despite this, with a substantial pull back in the “momentum factor”, the strategy underperformed S&P.
Figure 3 · LC Momentum Index: GICS sector weights through time)
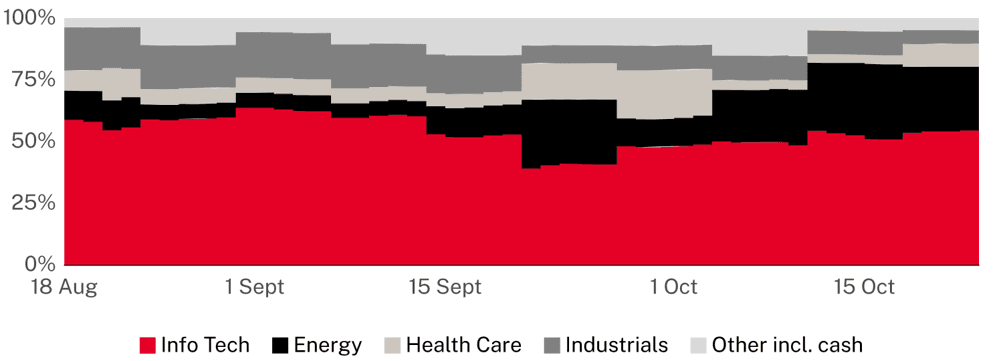
Weights at each prior close; changes occur at the weekly rebalance and through price drift. Source: Lighthouse Canton.
LC Systematic Global Equities: The fund tracked global equities closely through September (both about 4% above July launch levels on 2 October). Its 1 October rebalance placed semiconductors first, making SMH the largest position at 27–30%. The October rotation weighed on returns as a result, chiefly in the week to 16 October; the fund is −2.7% since launch. The strategy is slightly behind ACWI’s performance as of 23rd Oct.
Both strategies applied their rules as designed: they held the leaders while leadership persisted, and both filters have since moved to some cash. What separated them in October was rebalancing frequency and universe breadth.
Outlook: a factor in transition
History points to stabilization, with exceptions. Since MTUM launched in 2013 it has lagged the S&P 500 by 5% or more over 20 trading days in ten distinct episodes. In seven it outperformed over the next three months (median +2.3%), and in nine its absolute return was positive (median +10.7%). The three exceptions, December 2021, January 2023 and July 2026, came as rising rates and new leadership rewrote momentum’s holdings, a backdrop closer to today’s; after the first two, momentum lagged for a further six months (by 8% and 10%). This year’s moves have also been unusually large: July’s unwind (−15.5% relative over 20 days) was the largest in MTUM’s history and October’s (−8.7%) the fourth largest.
The signal will keep rotating even if prices do not. Momentum is measured over a rolling window – in the absence of a “V-Shaped” recovery, and a prolonged bear market, momentum is expected to shift towards a more defensive allocation.
Sector ETF | 12-1 month (rank) | 3 months (rank) | 12-1 month in 3 months (rank) |
Semiconductors (SMH) | +78% (1) | −4% (9) | +32% (2) |
Energy (XLE) | +47% (2) | +20% (1) | +44% (1) |
Technology (XLK) | +37% (3) | +5% (3) | +27% (3) |
Health Care (XLV) | +18% (4) | +10% (2) | +15% (4) |
Cons. Staples (XLP) | +5% (8) | +4% (4) | +9% (5) |
Industrials (XLI) | +12% (6) | −10% (12) | +1% (10) |
Ranks among twelve US sector ETFs (eleven Select Sector SPDRs plus SMH). Source: Yahoo Finance; Lighthouse Canton.
Positioning is lighter, but the semiconductor link remains. Fewer managers now name semiconductors as the most crowded trade, and hedge fund net leverage is at a one-year low, leaving less scope for forced selling. But momentum’s correlation with semiconductors (0.90) is still near its peak, so November’s chip earnings remain the main near-term test.
The hedges are built for market declines. Both strategies carry a market-trend overlay that moves part of the portfolio into cash when the broad market weakens and reinvests as it recovers. Applied to the S&P 500 for illustration, it would have reduced the peak-to-trough loss from 47% to 36% in 2000–02 and from 55% to 39% in 2007–09, and left a hedged S&P 500 investment 8% below its 2007 peak by the end of 2009, rather than 25%. Applied to MTUM, it reduced the decline in each of the last four major sell-offs by 5 to 11 percentage points (table below).
Episode | Fall: S&P 500 | Fall: MTUM | Fall: with overlay | Rebound: MTUM | Rebound: with overlay |
Q4 2018 (V-shaped) | −19.3% | −21.2% | −15.0% | +24.1% | +17.5% |
Covid 2020 (V-shaped) | −33.7% | −34.1% | −23.2% | +41.8% | +26.4% |
2022 (sustained bear) | −24.5% | −25.4% | −20.7% | +4.8% | −1.5% |
Tariffs 2025 (V-shaped) | −18.8% | −20.9% | −15.1% | +33.2% | +21.4% |
Fall: S&P 500 peak to low. Rebound: from the low to 30 Apr 2019, 8 Jun 2020, 31 Mar 2023 and 30 Jun 2025. ‘With overlay’ is hypothetical: MTUM total return with LC’s market-trend overlay applied, cash earning T-bill rates, before costs. Illustrative only; not the performance of any LC strategy. Source: Yahoo Finance; Lighthouse Canton.
A sustained bear market suits them better than a V-shaped rebound. In a slow, prolonged decline the overlay has time to act, and momentum itself rotates towards the sectors still rising, as it did into energy in 2022 and again this October. A sharp V works against both. Cash is highest near the low, and the steepest rebounds are led by the previous losers, which momentum does not own: from March to May 2009, the past year’s losers rose 163% while its winners gained 8% (Daniel and Moskowitz).
The strategy’s own record shows the same pattern. In its forward test (July 2025 to August 2026, net of fees), the LC Momentum Index gained 44%, against 25% for the S&P 500 and 35% for SPMO, capturing about 130% of the market’s weekly gains but 94% of its losses. In the March 2026 sell-off it fell broadly in line with the market (−9.3% vs −8.6%) despite its higher market sensitivity, then recovered its losses within two weeks of the low.
What this means now. If October’s pullback develops into a sustained decline, the overlay would add to cash and momentum signals would keep tilting towards energy and defensive sectors, the conditions in which the approach has historically held up best. If the market instead rebounds sharply, led by October’s losers in semiconductors, the strategies would likely lag at first, held back by cash and the energy tilt, before the signals catch up.
What to watch
◆ Policy and politics: the FOMC meets on 27–28 October, the US midterms are on 3 November, and October CPI follows on 10 November.
◆ Earnings: Intel, SanDisk and Korea’s memory makers (29 October), AMD (3 November) and Nvidia (expected mid-November); refiners Phillips 66 and Marathon report on 28 October and 3 November.
Disclaimer: Lighthouse Canton Pte Ltd. (“LCPL”) is incorporated in the Republic of Singapore (Registration No: 201422117K) and regulated by the Monetary Authority of Singapore (Capital Markets Services Licence No. CMS100443). Lighthouse Canton Capital (DIFC) Pte Ltd (“LCC”) is incorporated in Dubai International Financial Centre (Licence No. CL 2614) and regulated by Dubai Financial Services Authority (Category 3C Licence No. F004068). The financial products offered by LCPL and LCC are only available to Accredited Investors and Institutional Investors as defined by MAS and Professional Investors as defined by DFSA. The information in this electronic transmission does not constitute an offer, or intention by, or on behalf of LCPL and/or LCC, to subscribe, purchase or sell any financial products and/or services. LCPL and LCC accept no liability for any loss arising from the use of any information contained herein. The contents of this email are confidential and meant for the intended recipient only.