
Investment Insights
The market is pricing too much Fed | Fixed Income Insight
Joydeb Chatterjee, CFA, Executive Director - Investment Advisory and Fixed Income Selections, Lighthouse Canton

Table of Contents
Fair value of the 10Y and 30Y US Treasury yield: a building block view
Treasuries are cheap, but not yet cheap enough.
1. Our view in brief
Tenor | Market yield, 25 Sep 2026 | House fair value | Base case range | Market minus fair value | Valuation signal |
|---|---|---|---|---|---|
10Y UST | 5.17% | 4.90% | 4.70% to 5.10% | +27 bp | Cheap (yield above fair value) |
30Y UST | 5.49% | 5.35% | 5.10% to 5.60% | +14 bp | Modestly cheap |
10s30s curve | 32 bp | 45 bp | – | −13 bp | Curve too flat |
Source: US Treasury daily par yield curve; Lighthouse Canton estimates. The base case range reflects ±30 bp on the nominal neutral rate or ±20 bp on the 10Y term premium.
Our building block framework places fair value for the 10 year US Treasury at 4.90% and for the 30 year at 5.35%. At the 25 September close, the 10Y traded 27 bp cheap and the 30Y 14 bp cheap to these estimates, with market yields sitting above fair value in both cases. Fair value also implies a 10s30s slope of 45 bp, against the 32 bp currently priced. We regard these estimates as valuation anchors over a 12-to-24-month horizon rather than as near term targets.
House positioning. We would look to add duration in each tenor once yields trade at least 50 bp cheap to our fair value estimates.
Two explicit risk premia are embedded. Expected inflation carries a geopolitical premium of 0.15% to reflect the Iran war and the associated energy disruption. The expected real rate carries a fiscal premium of 0.21% for the 10Y and 0.32% for the 30Y, reflecting a federal debt ratio projected to climb from 101% to 120% of GDP by 2036. Together, the two premia add 36 bp to the 10Y and 47 bp to the 30Y.
Most of the remaining gap reflects expected policy rates. The market prices an average short rate of about 4.41% over the next decade, as measured by the New York Fed ACM risk neutral yield, compared with our 4.10% including both premia. Our 10Y term premium of 0.80% sits between the ACM estimate of 0.73% and the Kim-Wright estimate of 0.96%.
The view rests on two judgements. The first is that the tightening cycle which began with the 16 September hike to a 3.75% to 4.00% target range remains shallow. The second is that the nominal neutral rate is about 3.50% before the fiscal premium. That is above the FOMC longer run median of 3.2%, but below the neutral rate of more than 4% implied by the forward curve.
Alternative models broadly corroborate the estimate. Across eight alternative approaches, 10Y fair value ranges from 3.80% to 5.21% with a median of 4.46%, and 30Y fair value from 4.30% to 5.57% with a median of 4.87%. None of these approaches carries an explicit geopolitical or fiscal premium. Adding our premia to the medians gives 4.82% and 5.34%, close to our own estimates.
The principal risks would lift fair value. A deeper hiking cycle, a larger geopolitical shock or faster fiscal deterioration would each raise our estimates. Every 25 bp added to our long run policy anchor lifts 10Y fair value by about 15 bp and 30Y fair value by about 22 bp, while applying the CBO long term debt path in place of its 10-year baseline would add 36 bp to the 30Y.
2. How we calculate fair value
2.1 The framework
Fair value = Expected inflation + Expected real short rate + Term premium
where expected inflation includes a geopolitical premium and the expected real short rate includes a fiscal premium
Each term is an average over the life of the bond, ten years for the 10Y and thirty years for the 30Y, rather than a spot reading today.
Expected inflation is the expected annual average headline CPI rate over the life of the bond, built as a baseline macro path plus a geopolitical inflation premium. We use CPI rather than PCE so that the figures line up with TIPS and breakevens. The expected real rate is the expected average real policy rate, defined as the nominal Fed funds path less baseline CPI inflation, plus a fiscal real rate premium. It is distinct from the TIPS yield, which also contains a real term premium. The term premium is the nominal term premium, the additional compensation investors demand for holding duration rather than rolling Treasury bills. It captures the real rate risk premium, the inflation risk premium, and supply and liquidity effects.
The additive form ignores the Fisher cross term, which is worth about 4 bp at current levels.
2.2 Component one: expected inflation
Backdrop. Headline CPI rose 3.4% year on year in August 2026 and headline PCE 3.7% in July, both lifted by the energy shock. The September FOMC projections show PCE inflation at 3.7% in 2026, 2.3% in 2027, 2.1% in 2028 and 2.0% in 2029 and over the longer run, so inflation is not expected to return to target until 2029.
Baseline path. We assume CPI inflation of 3.00% in year one, 2.60% in year two and 2.40% in year three, settling at 2.30% from years four to ten. The 2.30% steady state equals the 2.0% PCE target plus a structural wedge of about 0.3 pp between CPI and PCE. The baseline averages 2.41% over ten years and 2.34% over thirty.
A geopolitical inflation premium of 0.15% over the life of both bonds. The baseline assumes the energy shock fades in line with the FOMC projections. We add a flat premium because geopolitical risk is unlikely to recede on that timetable. The Dallas Fed estimates that a closure of the Strait of Hormuz lasting three quarters would add 1.1 pp to 2026 headline inflation, while the ECB finds that the Iran war raised consumers’ three year ahead inflation expectations by 0.44 to 0.87 pp, echoing the lasting scarring effect observed after the Ukraine shock. We size the premium at 15 bp, which takes our 10Y inflation estimate to 2.56%, in line with the Cleveland Fed model reading of 2.57%.
Result. Expected inflation is 2.56% for the 10Y (2.41% plus 0.15%) and 2.49% for the 30Y (2.34% plus 0.15%).
Cross check | Horizon | Value | Comment |
|---|---|---|---|
House expected inflation, including premium | 10Y / 30Y | 2.56% / 2.49% | Baseline 2.41% / 2.34% plus 0.15% geopolitical premium |
Philadelphia Fed SPF (Q3 2026) | 10Y CPI | 2.30% | Survey; 5Y CPI 2.60% |
Cleveland Fed model (Sep 2026) | 10Y / 30Y | 2.57% / 2.61% | Model based; excludes the inflation risk premium |
10Y breakeven (nominal less TIPS) | 10Y | 2.34% | Market; includes inflation risk premium and liquidity effects |
30Y breakeven (nominal less TIPS) | 30Y | 2.27% | Market |
5y5y forward breakeven | 5Y forward | 2.34% | Long run anchoring intact |
Sources: Philadelphia Fed; Cleveland Fed; FRED; Lighthouse Canton estimates.
Our 2.56% sits at the top of the 2.30% to 2.57% band spanned by survey, market and model estimates, reflecting the geopolitical premium. Breakevens are lower, in part because TIPS illiquidity depresses them.
2.3 Component two: expected real short rate
Policy path. On 16 September the FOMC raised its target range by 25 bp to 3.75% to 4.00%, its first hike since 2023. The median dots place Fed funds at 4.1% at the end of both 2026 and 2027, 3.9% in 2028 and 3.6% in 2029, with a longer run median of 3.2% (central tendency 3.0% to 3.6%; range 2.9% to 3.9%). Swaps price three further 25 bp hikes by June 2027.
Baseline nominal path. We set years one and two at 4.35%, a blend of the FOMC projection of 4.1% and market pricing of about 4.6%, followed by 4.00% in year three, 3.75% in year four and a nominal neutral rate of 3.50% from years five to ten. The ten year average is 3.75%.
Why a 3.50% neutral rate. The New York Fed Laubach-Williams estimate of r* rose to 1.65% in the second quarter of 2026 from 1.36% in the first quarter of 2025. Governor Waller has signalled that he is likely to raise his own neutral estimate, and investment related to artificial intelligence is widely cited as an upward pressure. Laubach-Williams r* plus 2.0% PCE implies about 3.65%, while the FOMC median stands at 3.2%. We adopt 3.50%, in the upper half of the FOMC central tendency.
Baseline real rate. Subtracting the baseline CPI path from the nominal path gives real rates of 1.35%, 1.75%, 1.60% and 1.45% in years one to four, followed by a real neutral rate of 1.20% in CPI terms, or about 1.5% in PCE terms. The baseline averages 1.335% over ten years and 1.245% over thirty.
A fiscal real rate premium of 0.21% for the 10Y and 0.32% for the 30Y. The fiscal position continues to deteriorate. The CBO projects federal debt held by the public rising from 101% of GDP in 2026 to 120% in 2036, surpassing the 1946 peak of 106%, and the FY2026 deficit had already exceeded USD 1.9 trillion by August. The CBO estimates that each 1 pp rise in the debt ratio lifts long run interest rates by about 2 bp, and that holding debt at today’s ratio would lower the 10Y yield by 35 bp by 2035. We apply 2 bp for every 1 pp of projected debt increase, year by year. With the debt ratio rising by about 1.9 pp a year to 2036, the premium ramps from 4 bp in year one to 38 bp in year ten, averaging 0.21% for the 10Y. For the 30Y we hold the premium at 38 bp in years eleven to thirty, giving 0.32%. We do not extrapolate the CBO long term path, which reaches 175% of GDP by 2056, and treat that trajectory as a risk scenario instead.
Result. The expected real rate is 1.54% for the 10Y (1.335% plus 0.21%) and 1.57% for the 30Y (1.245% plus 0.32%).
TIPS cross check. The 10Y TIPS yield stands at 2.83%. Set against our 1.54% expected real rate, this implies a real term premium of about 1.29%, consistent with the Cleveland Fed real risk premium of 1.34%.
2.4 Component three: term premium
The term premium cannot be observed directly, so we triangulate across published models and history before setting a house value we can defend.
Estimate (10Y) | Latest | Date | Implied expected short rate |
|---|---|---|---|
NY Fed ACM (yield curve only) | 0.73% | 24 Sep 2026 | 4.41% |
Fed Board Kim-Wright (survey anchored) | 0.96% | 18 Sep 2026 | 4.05% |
SF Fed Christensen-Rudebusch | 1.33% | 24 Sep 2026 | 3.84% |
Cleveland Fed (real risk premium 1.34% plus inflation risk premium 0.46%) | 1.79% | Sep 2026 | 3.48% |
TD Economics survey of estimates | 0.80% to 1.00% | Sep 2026 | – |
ACM history, 1990 to 2026: mean / median | 1.06% / 0.96% | Monthly | Current reading at 43rd percentile |
ACM averages: 1990 to 2007 / 2010 to 2026 | 1.77% / 0.18% | Monthly | Before the GFC versus the QE era |
ACM history computed from NY Fed ACM monthly data. The Kim-Wright expected rate is the fitted yield (5.01%) less the term premium.
The case for a higher premium. Inflation uncertainty tied to the Iran war and the energy shock, Treasury supply that shows little sign of slowing, reduced holdings by foreign official investors and heavy bond issuance by hyperscalers and other AI related borrowers all argue for greater compensation.
The case against a much higher premium. Breakevens remain anchored. Morningstar interprets the rise as a reversion to the historical average driven by supply and demand rather than a crisis premium. Most of the 2026 rise in yields has come from the expected policy path rather than the term premium: TD attributes the roughly 80 bp increase in the 10Y since late February to about 50 bp of expected rates, 20 bp of term premium and 10 bp of inflation expectations.
A house 10Y term premium of 0.80%. This is close to the ACM and Kim-Wright average of 0.85% and at the low end of the 80 to 100 bp band cited by TD. We do not adopt the SF Fed or Cleveland Fed readings of 1.33% to 1.79% directly, because those models assign a much lower expected rate path of 3.48% to 3.84%, and combining their premium with our explicit path would be internally inconsistent. Since geopolitical and fiscal effects are already captured explicitly in the first two components, we keep the term premium close to the model consensus to avoid counting them twice.
A house 30Y term premium of 1.30%. The 30Y premium combines the 10Y premium over years one to ten with a forward premium over years eleven to thirty: (10 × 0.80% + 20 × 1.55%) ÷ 30 = 1.30%. We set the 1.55% forward premium between the ACM one year forward term premium at year ten (1.22% on 24 September) and the 1990 to 2007 average 10Y premium of 1.77%.
2.5 Bringing the components together
Component | 10Y UST | 30Y UST | Basis |
Baseline expected inflation (CPI) | 2.41% | 2.34% | House path; SPF, Cleveland Fed and breakeven cross checks |
+ Geopolitical inflation premium | 0.15% | 0.15% | Iran war and energy disruption |
= Expected inflation | 2.56% | 2.49% | |
Baseline expected real short rate | 1.34% | 1.24% | House policy path less CPI; 3.50% nominal neutral |
+ Fiscal real rate premium | 0.21% | 0.32% | 2 bp per 1 pp of projected debt increase |
= Expected real short rate | 1.54% | 1.57% | |
+ Term premium | 0.80% | 1.30% | ACM and Kim-Wright triangulation; 1.55% forward premium beyond year ten |
= Fair value | 4.90% | 5.35% | Building block estimate |
Market yield, 25 Sep 2026 | 5.17% | 5.49% | US Treasury par curve |
Market minus fair value | +27 bp | +14 bp | Positive indicates cheap (yield above fair value) |
Totals are computed on unrounded components. For the 30Y, 2.487% + 1.568% + 1.300% = 5.355%, shown as 5.35%.
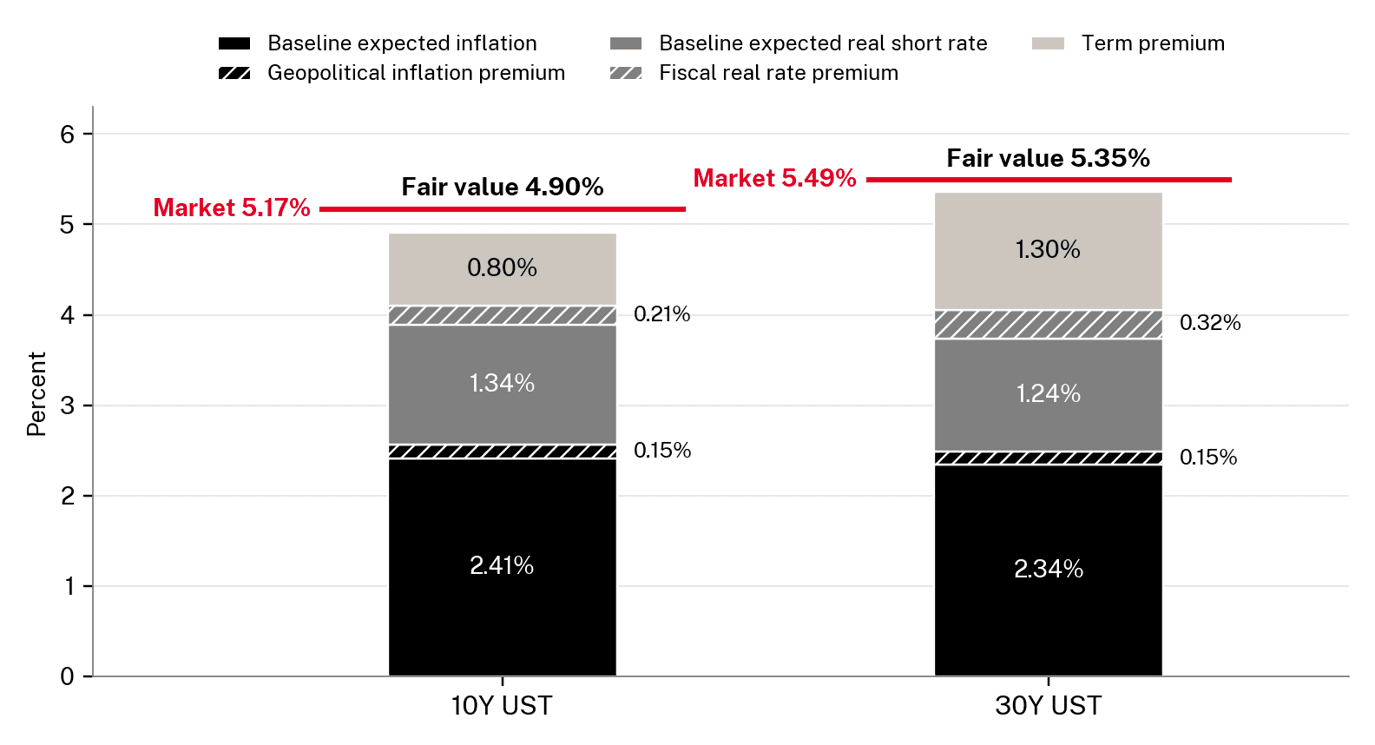
Figure 1: Fair value building blocks versus market yield. Hatched segments show the geopolitical and fiscal premia. Source: Lighthouse Canton estimates; US Treasury.
2.6 Where the gap to market comes from (10Y)
Setting our components against the ACM decomposition of the market yield breaks the 27 bp gap down as follows.
Driver | Market / ACM | House | Contribution to gap |
|---|---|---|---|
Expected average short rate, including house premia | 4.41% | 4.10% | +31 bp |
Term premium | 0.73% | 0.80% | −7 bp |
ACM fit residual (market 5.17% versus ACM fitted 5.14%) | +0.03% | – | +3 bp |
Total: market minus fair value | 5.17% | 4.90% | +27 bp |
Source: NY Fed ACM daily data, 24 September 2026; Lighthouse Canton estimates. The house expected short rate equals 2.56% inflation plus a 1.54% real rate. Pairing a 24 September decomposition with 25 September prices introduces minor timing noise.
The valuation call is therefore a view that the market continues to overprice both the path and the terminal level of policy rates, even after allowing for geopolitical and fiscal risk. Should the neutral rate prove higher than 3.50%, or the hiking cycle deeper than we assume, the measured cheapness would narrow broadly one for one.
3. Alternative models and the case for our approach
We assessed eight alternative approaches to estimating fair value. Most decompose the observed yield in a different way, or anchor it to a different long run rate.
Model | How it works | Strengths | Limitations |
|---|---|---|---|
A. NY Fed ACM | Five factor, arbitrage free model fitted to the Treasury curve alone; splits yields into risk neutral expected rates and term premium | Daily, market standard and maturity consistent to 10Y | Expectations track the forward curve closely; no survey anchor; 10Y maximum |
B. Kim-Wright (Fed Board) | Three factor, arbitrage free model incorporating Blue Chip survey rate forecasts | Survey anchor steadies long run expectations; lower volatility | Publication lag; survey inputs can be stale; 10Y maximum |
C. SF Fed (Christensen-Rudebusch) | Three factor, arbitrage free Nelson-Siegel model estimated with a Kalman filter; residual folded into term premium | Re-estimated in real time since 1998; parsimonious | Gaussian with no lower bound; residual inflates term premium; 10Y maximum |
D. Cleveland Fed | Treasuries, inflation swaps and surveys yield expected inflation, inflation risk premium, real rate and real risk premium from 1 to 30 years | Maps directly to our equation; covers 30Y | Monthly; attributes a very low expected real rate (0.91%) |
E. FOMC SEP path | Median dots as the rate path; 3.2% longer run rate | Official reaction function; transparent | Dots are not forecasts of market outcomes; slow to update on neutral |
F. r* anchor (Laubach-Williams) | House near term path with neutral set at LW r* (1.65%) plus 2.0% PCE, or 3.65% | Grounded in estimated equilibrium | r* estimates are imprecise and model dependent |
G. Survey (SPF long run) | Ten year average Treasury bill forecast (3.00%) plus term premium | Independent of market pricing | Q1 2026 vintage predates the selloff and the hike |
H. Nominal GDP heuristic | Long yield equals trend real growth (2.0%) plus inflation (2.2% PCE) | Simple long run sanity check | No cyclical or term premium content; loose empirical fit |
Sources: Federal Reserve; NY Fed; Fed Board; SF Fed; Cleveland Fed; Philadelphia Fed.
Why we favour the building block approach
It is independent of the market price. The ACM, Kim-Wright, SF Fed and Cleveland Fed decompositions reproduce the observed yield by construction, so their implied fair value is essentially the market itself. Our framework builds an anchor from explicit expectations and a justified premium, which allows us to judge whether bonds are rich or cheap.
Geopolitical and fiscal risks are priced explicitly. Other approaches either ignore these risks or absorb them into a model residual. We size each premium from published evidence from the Dallas Fed, the ECB and the CBO, so each can be examined and adjusted directly.
It is transparent and auditable. Every component rests on a stated, sourced assumption that can be tested line by line: the inflation path, the two premia, the policy path, the neutral rate and the term premium.
It maps to tradable instruments. Expected inflation lines up with breakevens and CPI swaps, real rates with TIPS and OIS, and the term premium with curve trades.
It covers the 30Y consistently. The major term structure models stop at ten years. Our method extends to thirty years using the same logic, an explicit forward term premium and a fiscal premium tied to CBO projections.
It is built for scenario analysis. Shocks to the Fed path, the neutral rate, the premia or the term premium can be run one at a time.
The trade off. The approach depends on judgement, since the premia and the term premium remain assumptions. We manage this by presenting the full range of model outcomes and sensitivities rather than relying on a single point estimate.
4. Fair value across models
To compare models on a like for like basis for expectations, we take each model’s view of expected rates and add our house term premium of 0.80% for the 10Y and 1.30% for the 30Y. The alternatives are shown without the house geopolitical and fiscal premia. For years eleven to thirty, we use each model’s own long run anchor where one exists.
Model | 10Y fair value | vs house | 30Y fair value | vs house |
|---|---|---|---|---|
House building block approach | 4.90% | – | 5.35% | – |
A. ACM expectations | 5.21% | +31 bp | 5.57% | +22 bp |
B. Kim-Wright expectations | 4.85% | −5 bp | 4.98% | −37 bp |
C. SF Fed (CR) expectations | 4.64% | −26 bp | 4.91% | −44 bp |
D. Cleveland Fed inflation and real rate split | 4.28% | −62 bp | 4.82% | −53 bp |
E. FOMC SEP path | 4.25% | −65 bp | 4.58% | −77 bp |
F. r* anchor (LW) | 4.64% | −26 bp | 5.01% | −34 bp |
G. Survey (SPF long run bill) | 3.80% | −110 bp | 4.30% | −105 bp |
H. Nominal GDP heuristic | 4.20% | −70 bp | 4.54% | −81 bp |
Alternative models: median | 4.46% | −44 bp | 4.87% | −48 bp |
Alternative models: mean | 4.48% | −42 bp | 4.84% | −51 bp |
Median plus house premia (0.36% / 0.47%) | 4.82% | −8 bp | 5.34% | −1 bp |
Alternative models: low to high | 3.80% to 5.21% | – | 4.30% to 5.57% | – |
Market, 25 Sep 2026 | 5.17% | +27 bp | 5.49% | +14 bp |
The comparison columns are computed from the rounded fair values shown.
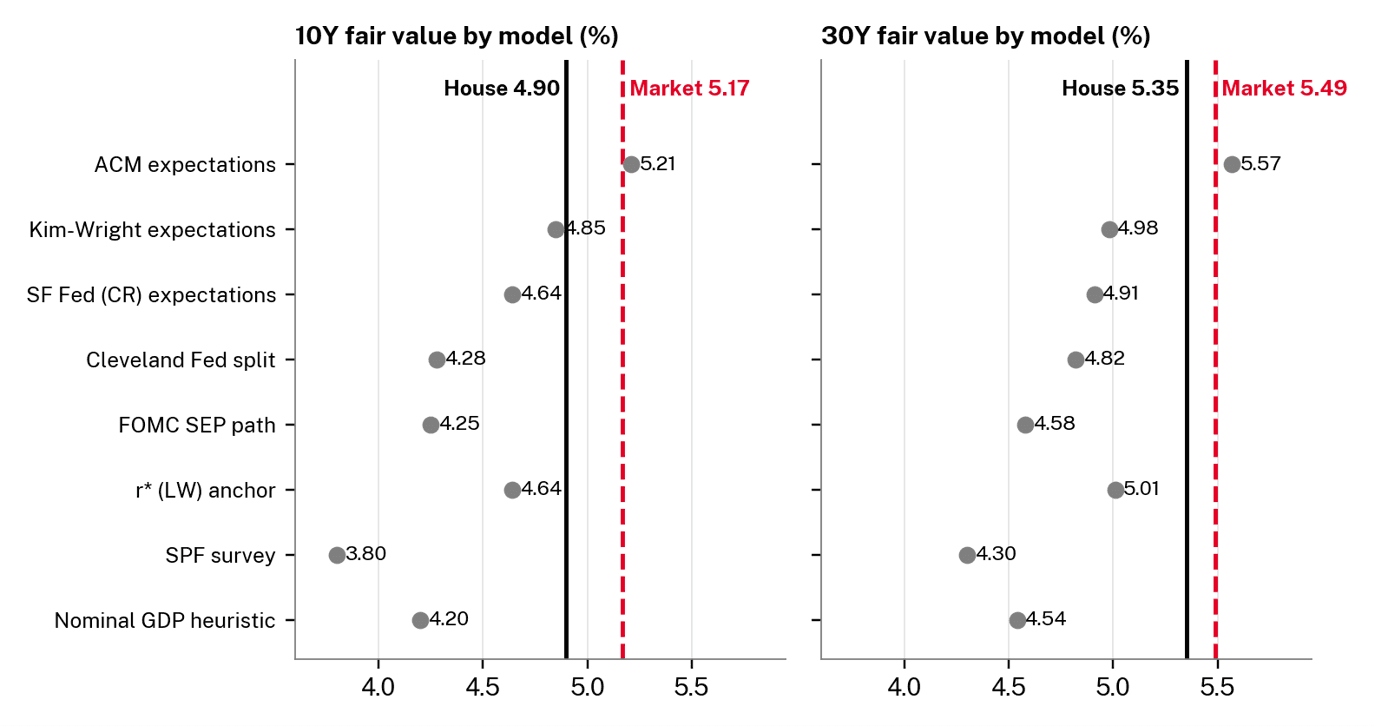
Figure 2: Fair value by model versus the house estimate and market yield. Source: Lighthouse Canton calculations using Federal Reserve and regional Federal Reserve Bank data.
Sensitivity to the choice of term premium
The reverse exercise pairs our expected rate path of 4.10%, including premia, with each model’s own 10Y term premium. It shows how far the term premium estimate alone can move fair value.
Term premium source | Model term premium | House expectations plus model term premium | Model fitted yield (market consistent) |
NY Fed ACM | 0.73% | 4.83% | 5.14% (24 Sep) |
Kim-Wright | 0.96% | 5.06% | 5.01% (18 Sep) |
SF Fed (CR) | 1.33% | 5.43% | 5.17% (24 Sep) |
Cleveland Fed (real risk premium plus inflation risk premium) | 1.79% | 5.89% | 5.27% (Sep) |
House | 0.80% | 4.90% | – |
Sources: NY Fed; Fed Board; SF Fed; Cleveland Fed. The final column is each model’s expected rate plus its own term premium, which approximately reproduces the market yield.
Reading the range. Most approaches cluster between 4.20% and 4.85% for the 10Y and between 4.54% and 5.01% for the 30Y. Our estimates sit above these clusters because they include explicit geopolitical and fiscal premia; adding the same premia to the cross model medians lands within 8 bp of our estimates. Only the ACM expectations approach, which takes the policy path implied by the forward curve at face value, sits above the current market level.
5. Risks and model variance
5.1 Variance against our approach
Model | 10Y variance | 30Y variance | Main source of variance |
|---|---|---|---|
A. ACM | +31 bp | +22 bp | Accepts market implied hikes and a long run forward rate of about 4.2% |
B. Kim-Wright | −5 bp | −37 bp | Survey anchored path (4.05%); no explicit fiscal premium beyond year ten |
C. SF Fed (CR) | −26 bp | −44 bp | Expected path (3.84%) without house premia |
D. Cleveland Fed | −62 bp | −53 bp | Higher inflation (2.57%) but a much lower real rate (0.91%) |
E. FOMC SEP | −65 bp | −77 bp | Lower dots and a 3.2% longer run rate |
F. r* (LW) | −26 bp | −34 bp | 3.65% neutral but no premia |
G. SPF survey | −110 bp | −105 bp | Stale 3.00% long run bill forecast |
H. Nominal GDP | −70 bp | −81 bp | No term premium; PCE based inflation |
Dispersion (standard deviation) | 44 bp | 38 bp | Across the eight alternatives |
Variance is the alternative model fair value less the house fair value.
Seven of the eight alternatives sit below our estimate for both tenors. Most of that difference reflects the 36 bp (10Y) and 47 bp (30Y) of geopolitical and fiscal premia, which the alternatives do not carry explicitly. Excluding the premia, the median alternative would sit within 9 bp of our 10Y expected rate view. The size of the two premia and the level of the neutral rate are therefore the judgements that matter most.
5.2 Risks that would push fair value higher
A deeper Fed cycle. The market prices three further hikes by mid 2027, and CME odds of an October hike reached 66% following strong September activity data. Moving our year one and two path to market pricing of about 4.6% would add about 5 bp to 10Y fair value.
A higher neutral rate. Each 25 bp added to our 3.50% neutral raises 10Y fair value by 15 bp and 30Y fair value by 22 bp. At a 4.00% neutral, 10Y fair value rises to 5.20%, above the current market yield.
Faster fiscal deterioration. Applying the Dallas Fed estimate of 3 bp per 1 pp of debt to GDP, in place of the CBO estimate of 2 bp, raises the fiscal premium to 0.31% for the 10Y and 0.48% for the 30Y, adding 10 bp and 16 bp respectively. Following the CBO long term path to 175% of GDP by 2056 would add a further 36 bp to the 30Y, taking fair value to about 5.71%, above the market.
A larger geopolitical shock. A prolonged closure of the Strait of Hormuz or a wider conflict could lift the geopolitical premium, with each additional 10 bp adding 10 bp to both tenors. The Cleveland Fed 30Y inflation expectation of 2.61% already sits 12 bp above our 2.49%.
A shift to a higher term premium regime. Heavy supply and weaker foreign official demand could take the term premium back toward its average of about 1.8% before the global financial crisis. Each 20 bp added to the 10Y premium adds 20 bp to fair value.
5.3 Risks that would push fair value lower
Growth slowdown or recession. Real wages are falling, with average hourly earnings down 0.3% year on year in real terms in August. A downturn would bring forward rate cuts toward the FOMC longer run rate of 3.2% or below, lowering 10Y fair value toward 4.60%.
An easing of geopolitical tensions. A swift resolution of the disruption in the Middle East would pull the near term inflation path lower and justify removing the geopolitical premium, reducing fair value by up to 15 bp in both tenors.
Fiscal consolidation. A credible deficit reduction package would flatten the projected debt path and shrink the fiscal premium. Holding debt at today’s ratio would remove the premium entirely, lowering fair value by 21 bp for the 10Y and 32 bp for the 30Y.
A flight to quality. In a risk off episode, Treasuries tend to regain their hedging value, compressing the term premium toward its 2010 to 2026 average of 0.18%.
5.4 Model and measurement risks
The premia are judgements. The geopolitical premium is calibrated to the Cleveland Fed model and survey evidence, while the fiscal premium relies on a rule of thumb of 2 to 3 bp per 1 pp of debt, estimated on historical data. Either could prove larger or smaller.
The premia may overlap with the term premium. Part of the geopolitical and fiscal effect may already be embedded in published term premium estimates. We keep the house term premium close to consensus to limit double counting, although some overlap is likely to remain.
The term premium is unobservable. Estimates for the same 10Y bond on the same day range from 0.73% to 1.79%, and every 20 bp change moves fair value one for one.
Par and zero coupon yields differ. Published term premium models use zero coupon yields. The bootstrapped 10Y zero coupon yield of about 5.21% is only about 4 bp above the 5.17% par yield; for the 30Y, the zero coupon yield sits about 7 bp above par.
Timing. Model inputs are dated 18 to 24 September, while market prices are as of 25 September, and yields moved by more than 20 bp in the final week.
5.5 Conclusion
Including a 15 bp geopolitical inflation premium and a fiscal real rate premium of 21 to 32 bp, our building block framework places fair value for the 10Y at 4.90% (range 4.70% to 5.10%) and the 30Y at 5.35% (range 5.10% to 5.60%), against market yields of 5.17% and 5.49%. The 10Y screens 27 bp cheap and the 30Y 14 bp cheap. Fair value implies a steeper curve than the market, at 45 bp on 10s30s against 32 bp, so the 10Y offers better value than the 30Y.
The cheapness rests mainly on our view that the policy path and long run neutral rate priced into the curve are too high. At the 30Y the cushion is thin, and a stronger fiscal response or a higher neutral rate would erase it. We view the 10Y gap as a medium term valuation cushion rather than a near term catalyst, and we remain more cautious at the long end. We will revisit the estimate at each FOMC meeting and CPI release, at each CBO update, and whenever the 10Y term premium moves by more than 25 bp.
What we are monitoring. Six signals would prompt us to reassess: OIS terminal rate pricing above 4.75%; the 5y5y breakeven above 2.60%; oil supply developments in the Strait of Hormuz; CBO baseline revisions and Treasury refunding sizes; the ACM 10Y term premium above 1.10%; and tails at 10Y and 30Y auctions.
Detailed working available upon request. The full supporting analysis, including the year by year expected paths, compounding and Fisher checks, the 30 year extension, sensitivity grids, alternative model workings and the complete set of market and model inputs, is available from your Lighthouse Canton relationship team upon request.