
Investment Insights
When There Is Blood on the Street
Sunil Garg, CMT, Chief Investment Officer

When there is blood on the street
As the old line, often credited to Baron Rothschild, goes, “buy when there is blood on the street”. There is plenty of red in most portfolios right now. So should we buy?
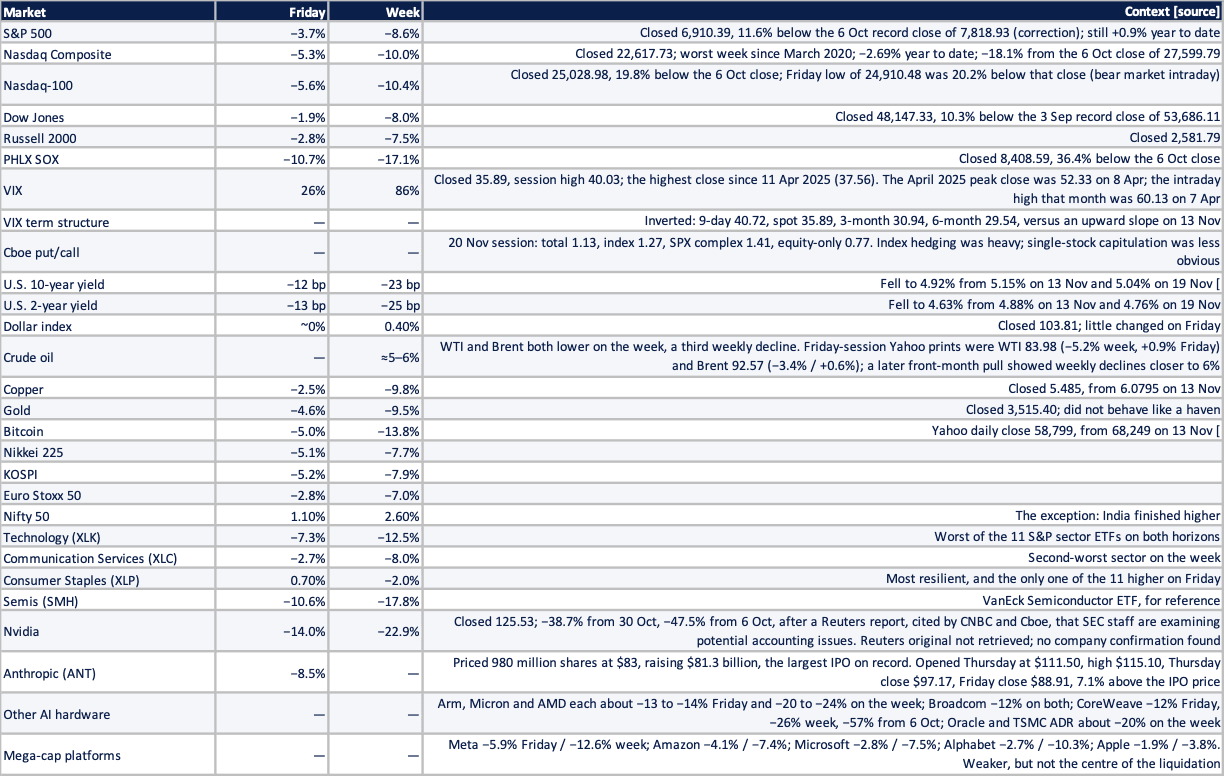
It takes a special kind of courage to buy into a week like the last one. The Nasdaq had its worst week since March 2020, down 10.0%, and is now negative for the year, down 2.69% year to date. Tech led the way down, but nothing was spared. Equities, gold, copper, oil, Bitcoin. Only Treasuries survived. A VIX close of 35.89, the highest since 11 April 2025, tells you how deep the panic ran. Last week the market did not rotate. It liquidated.
The week at a glance, ended 20 November 2026
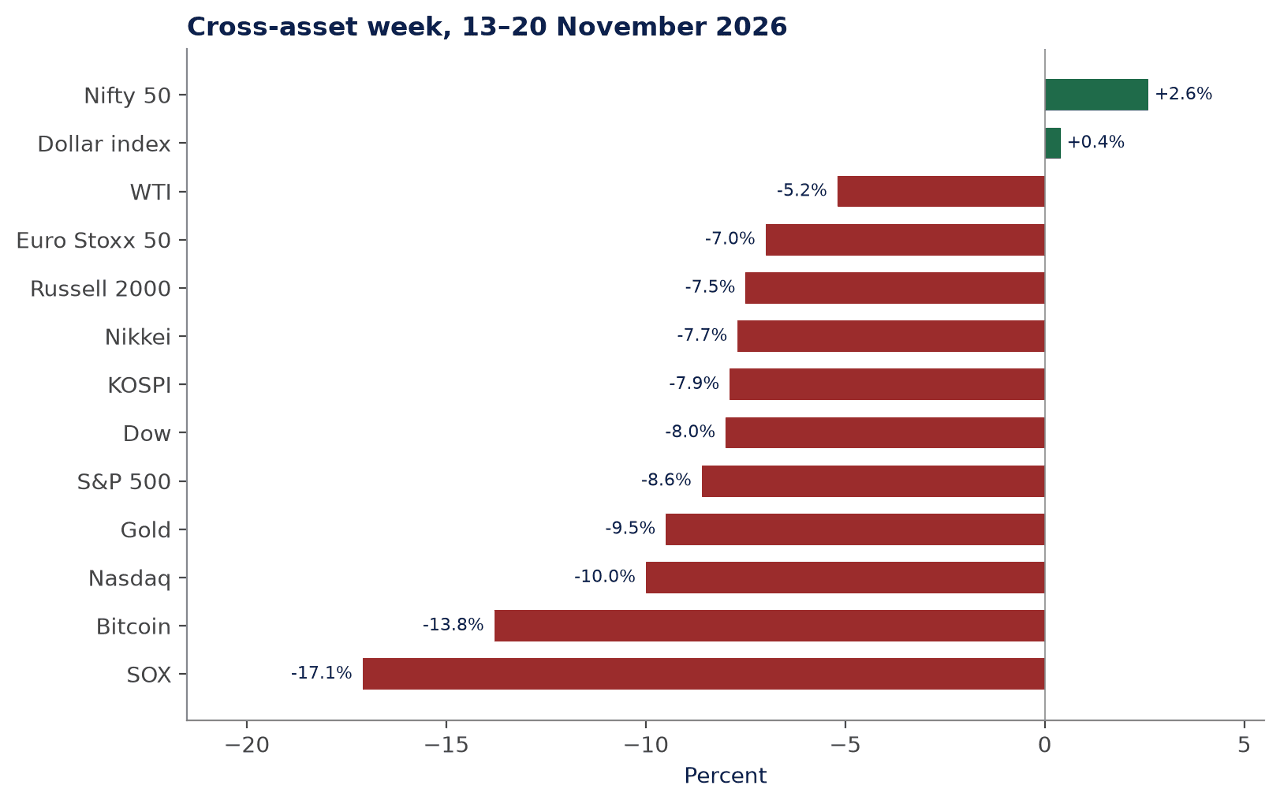
Cross-asset week, 13–20 November 2026
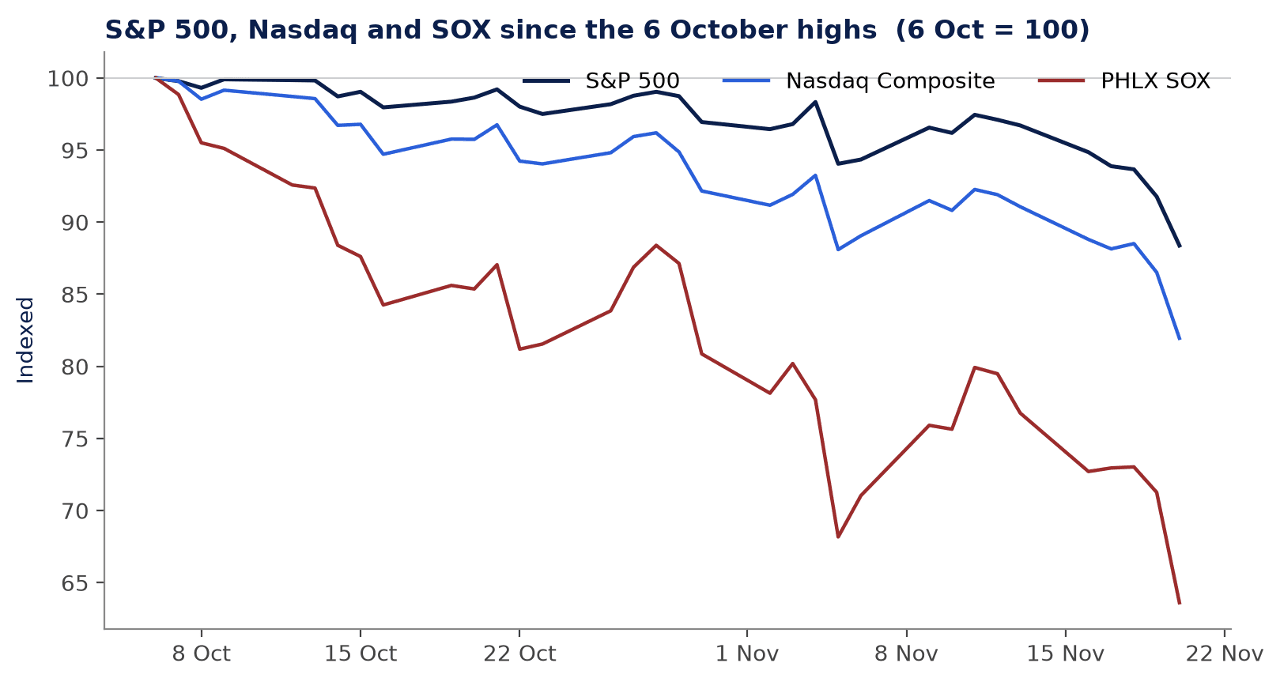
S&P 500, Nasdaq Composite and PHLX SOX, indexed to 100 at the 6 October closing highs
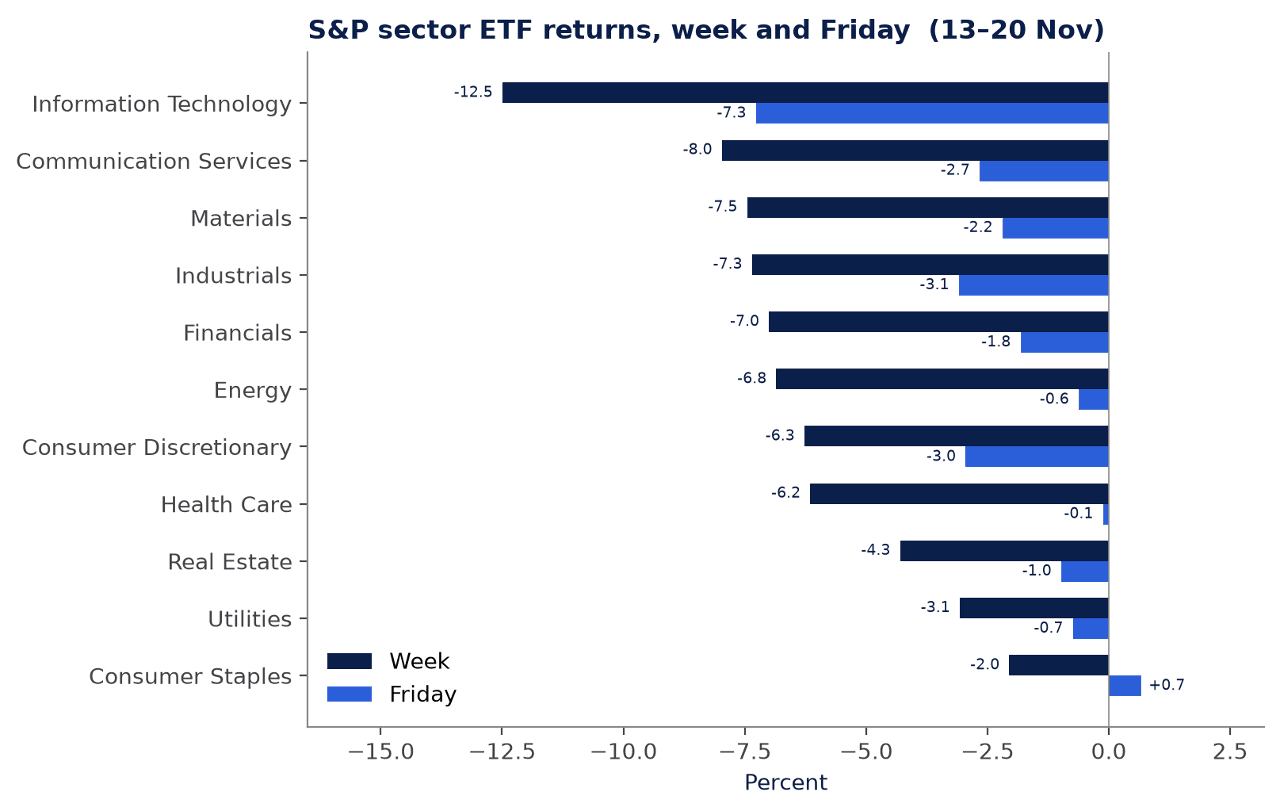
The liquidation was concentrated in technology and the chip complex, but it was not a defensive rotation. All eleven S&P sector ETFs finished the week lower.
Sector ETF returns, week and Friday
Two concerns, one tape
The market is worried about two things. First, inflation and what it means for monetary policy. Second, whether AI capex will ever be monetized. Both concerns are real. But pinning last week’s panic on them overstates the case. A sell-everything tape - stocks, gold, oil and copper down together, with only government bonds catching a bid - looks more like serious leverage being unwound. Gold fell 9.5% on the week. Copper fell 9.8%. Those are not the fingerprints of a rotation into safety. They are closer to a margin call: forced sellers raising cash wherever the bid still is.
The wrong tool for this inflation
Start with inflation and rates. Central bankers seem to be competing for credibility by calling for bigger hikes, and the mood across the pond is just as hawkish. The federal funds rate sits in a 3.75-4.00% range, after a 25-basis-point hike in September - the first in more than three years - and a hold in late October. On 18 November Governor Christopher Waller told CNBC that inflation was “headed in the wrong direction, and it’s spreading out,” and that a 50-basis-point hike at the 8–9 December meeting was probably necessary unless the Fed raised 25 basis points and clearly signalled another move in January. Other officials, including John Williams, argued against dramatic action. Markets are pricing a December quarter-point hike, not a half-point shock.
The Bank of England has already moved, raising Bank Rate 25 basis points to 4% at its meeting ending 4 November. The European Central Bank held on 29 October, in what was read as a hawkish hold; a mid-November Reuters poll had economists unanimously expecting a December hike.
They are right to worry about inflation. October CPI rose 0.4% month on month, more than the 0.3% consensus, and core rose 0.3% versus 0.2%. September was 3.7% year over year. The BLS published no October year-over-year rate, because the 2025 government shutdown left no comparable collection. The Fed’s preferred gauge, September PCE, is up 3.6% year over year, 3.1% at the core. October PCE is due on 25 November. But their preferred tool, higher rates, does nothing for the supply-side forces driving it.
A Fed hike will not unclog Hormuz. An ECB hike will not calm the Houthis. And a Bank of England hike cannot add a gigawatt to the grid by December.
The Iran war began with U.S. and Israeli strikes in late February. CNBC said Hormuz shipments had returned to roughly pre-war levels, which is why oil eased on the week even as two tankers hit mines in the Strait and UOB described attacks at roughly one a day in November. Houthis fired on Riyadh on Thursday and warned workers near Jeddah to evacuate. That risk premium can return in a session.
From oil to electricity to the price of eggs, this is a supply problem, and higher rates will not solve it. October CPI electricity rose 0.9%, a data-centre fingerprint. Energy was still in the autumn inflation data after the February strikes. Philadelphia Fed President Anna Paulson listed tariffs, energy and the AI buildout as the main factors keeping inflation elevated, and said tariff effects were “beginning to fade” - apparel, a tariff-sensitive category, barely moved.
Inflation components, latest official prints
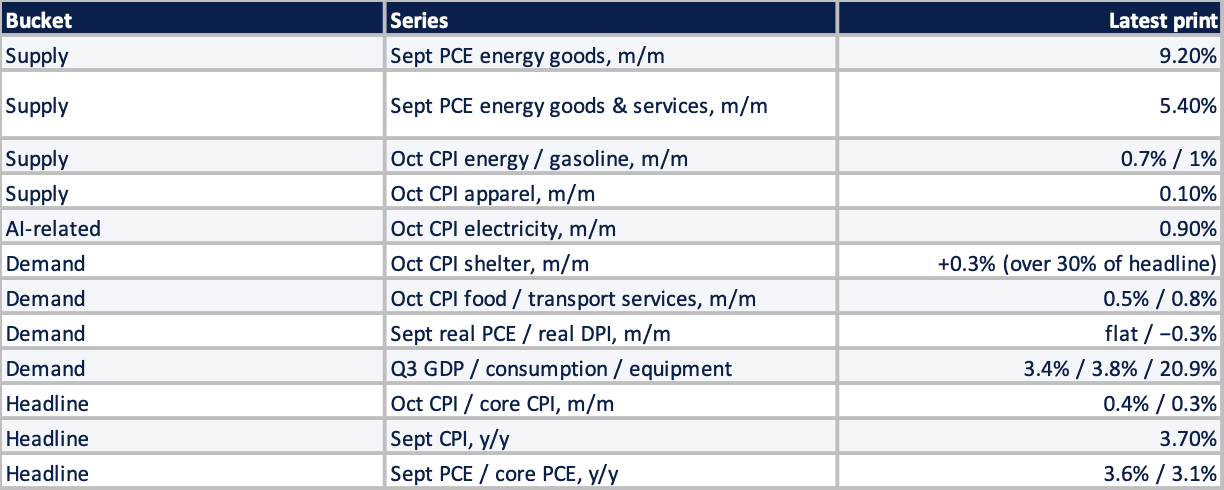
Nor will higher rates slow AI capex. The 2022 inflation was driven by demand, and higher rates helped. This time they will only add to the pain on Main Street, and set a glide path to recession or, worse, stagflation. Real average hourly earnings were unchanged in October, because a 0.4% rise in pay was matched by a 0.4% rise in CPI-U. The 30-year mortgage rate jumped to 7.28% last week, from 7.11%. Michigan consumer sentiment rose to 51.5 in November from 48.0, still about 9% below February, before the Iran conflict. Shelter, services and firm third-quarter spending - GDP at a 3.4% annual rate, consumption at 3.8% - are the demand part of the mix. The Fed can cool those. It cannot reopen the Strait, and it cannot add power to the grid by December.
That’s the macro bear case. The capex case is where the market has it most wrong.
Where the market has it most wrong
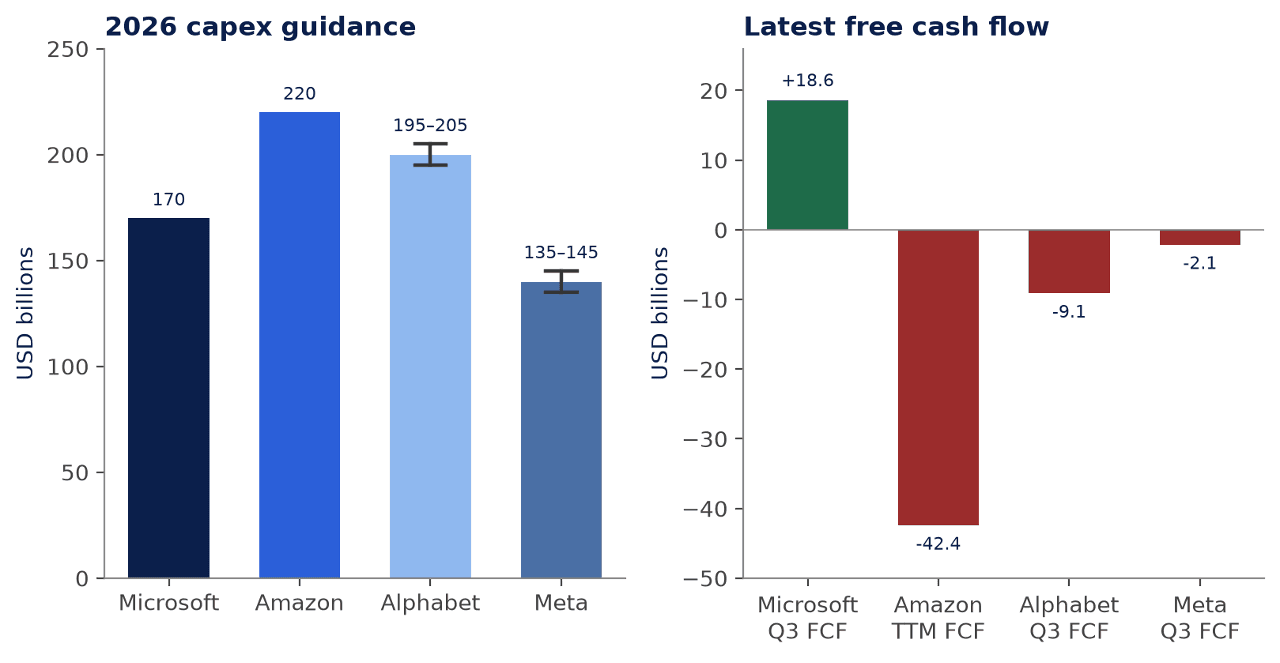
The monetization question is fair. Free cash flow is shrinking across the data-centre builders, and at Amazon it has already turned negative. Microsoft, in the quarter ended 30 September, still generated $18.6 billion of free cash flow, down 27% year over year, on capital expenditure of $45.2 billion. Alphabet’s third quarter was a $9.1 billion outflow, on capex of $51.4 billion, but trailing-twelve-month free cash flow was still a $19.7 billion inflow. Amazon’s trailing free cash flow was an outflow of $42.4 billion. Meta’s third quarter was a $2.12 billion outflow. The four large spenders have pointed to some $720-740 billion of 2026 capital expenditure.
Hyperscaler capex, cash flow and balance-sheet markers

2026 capex guidance
In our recent report, Money Breaks First, we argued that anyone waiting for demand to falter is looking at the wrong side of the equation. Cloud growth at the hyperscalers is accelerating, and on a very large base. Azure rose 48%. AWS rose 39.3%, to a $184 billion run-rate. Google Cloud rose 103%. Microsoft’s contracted backlog is $677 billion; Google Cloud’s is $561 billion. Amazon said Bedrock token volume grew nearly 17 times. Demand for compute is real, and it is premature to talk about saturation.
Trouble usually starts with how that demand is financed. That is also where the differences, and the opportunities, lie. Operating cash flow at these companies is still enormous. Meta alone held $82.45 billion of cash and securities at quarter-end. Around the fringe, debt-funded neoclouds have been treated far more harshly than the investment-grade parents.
One company’s capex is another company’s revenue and earnings. Amazon’s negative free cash flow is being spent on GPUs, memory, networking and power. That is revenue for Nvidia, Micron and AMD, and for the companies that wire and power the data centres.
If you fear more capex, you can’t fear for chip demand. If you fear less capex, you can’t fear negative free cash flow. You can’t have both.
Dig a little deeper and the selling looks indiscriminate. Leverage is still manageable. Capital markets are still open - Anthropic priced the largest IPO on record in the same week the complex was being sold . And valuations are attractive.
Forced sellers don’t check fundamentals
The tape has priced a nightmare. The receipts still show demand, cash generation, and a supply shock that no rate hike will dissolve. Forced sellers don’t check fundamentals, and that is the opportunity.
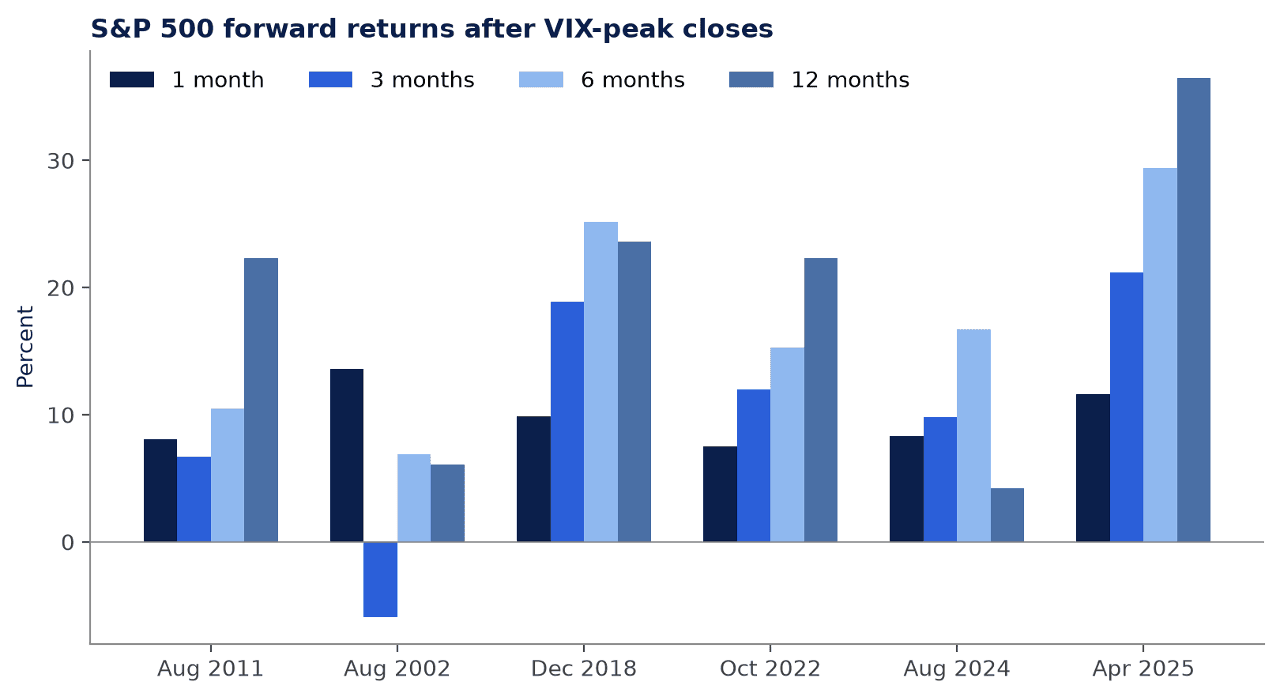
Friday’s VIX close of 35.9 is the highest since 11 April 2025, when it closed 37. 6. It sits in a familiar neighborhood: 36.1 on 24 December 2018, 33.6 on 11 October 2022, 38.6 on 5 August 2024, and well below 52.3 on 8 April 2025. From those VIX-peak dates, the S&P 500’s subsequent path, measured close-to-close over 21, 63, 126 and 252 trading days, is set out in Table 4. One-month forward returns were positive in every case. That is a historical pattern, not a forecast. In August 2002 the three-month figure was negative, because the equity low arrived in October. The twelve-month return after August 2024 is only 4.2%, because that window includes the April 2025 tariff crash.
S&P 500 forward returns after VIX-peak closes
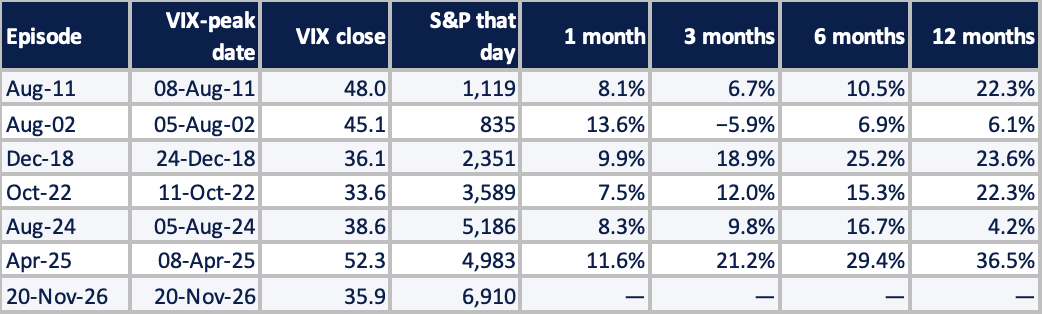
VIX close since 6 October, and the term structure on 13 versus 20 November (9-day, spot, 3-month, 6-month).
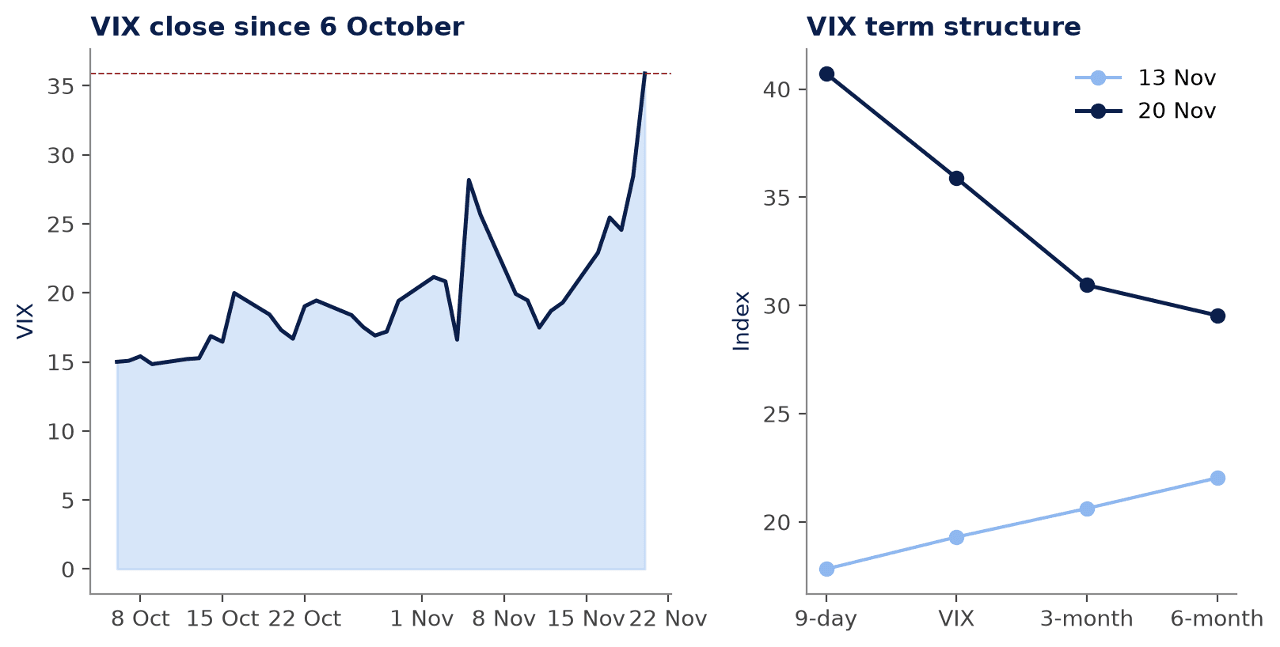
S&P 500 forward returns after prior VIX-peak closes.
Panics with the VIX above 35 have historically been buying opportunities, and profitable times to sell volatility. The set-up now is the inverted curve. A week earlier the term structure still sloped upward; by Friday, 9-day and spot VIX sat well above the 3-month and 6-month. That backwardation has often faded as spikes mean-revert, which is the usual argument for selling near-dated volatility after a flush. Neither trade is guaranteed, and you need room to ride out more panic. The left tail is not theoretical. The VIX closed at 37.3 on 5 February 2018, and at 82.7 on 16 March 2020. But the odds are in your favour.
Add longs. Sell volatility. Don’t go all in, because the left tail is still there. Size for it.
This is a washout, not a verdict.
Disclaimer: Lighthouse Canton Pte Ltd. (“LCPL”) is incorporated in the Republic of Singapore (Registration No: 201422117K) and regulated by the Monetary Authority of Singapore (Capital Markets Services Licence No. CMS100443). Lighthouse Canton Capital (DIFC) Pte Ltd (“LCC”) is incorporated in Dubai International Financial Centre (Licence No. CL 2614) and regulated by Dubai Financial Services Authority (Category 3C Licence No. F004068). The financial products offered by LCPL and LCC are only available to Accredited Investors and Institutional Investors as defined by MAS and Professional Investors as defined by DFSA. The information in this electronic transmission does not constitute an offer, or intention by, or on behalf of LCPL and/or LCC, to subscribe, purchase or sell any financial products and/or services. LCPL and LCC accept no liability for any loss arising from the use of any information contained herein. The contents of this email are confidential and meant for the intended recipient only.


