


Table of Contents
Key Statistics
01 Executive Summary
Oil has been the single most powerful driver of India’s macro narrative in 2026, and its sharp reversal — following the Iran–US MOU — marks a defining pivot for Indian markets.
This report documents that relationship in full: a structural negative correlation between Brent Crude prices and Foreign Institutional Investor (FII) equity flows into Indian equities, substantiated by 25+ years of daily data from January 1999 to June 2026. Eleven distinct historical episodes — spanning the GFC, the Arab Spring, the Russia–Ukraine war, and the 2026 oil spike and its subsequent reversal — individually and collectively confirm this dynamic.
The 2026 episode is not an anomaly; it is the latest, and perhaps clearest, expression of a relationship that has repeated itself across every major oil price cycle for two decades.
Key Findings
- Non-QE correlation of –0.26 across 2005–2026 (excluding the QE-override period) — the cleanest structural signal. Strengthens to –0.32 in the post-COVID period (2020–2026).
- The full-period correlation of –0.01 is statistically misleading, diluted by two anomalous regimes: Pre-Reform India (1999–2004), when oil had no macro relevance to FII flows, and the QE Era (2010–2014), when coordinated global QE overrode the oil headwind.
- Every major oil price spike (2008, 2011, 2018, 2022, 2026) coincided with FII outflows from Indian equities.
- Every major oil price correction (2009, 2015–16, H2 2022, H1 2023) was followed by meaningful FII inflows.
- India’s ~85% oil import dependency makes Brent a direct proxy for CAD risk, INR pressure and inflation — the three primary transmission channels to FII behaviour.
- The relationship is structural but not unconditional — dominant macro overrides (e.g. coordinated QE) can temporarily decouple the series. When those forces recede, the relationship reasserts with full force.
Bottom Line
When Brent rises above ~$90/bbl, India’s CAD deteriorates rapidly, the INR comes under pressure, and FIIs rotate out of Indian equities. When Brent eases below ~$75/bbl, all three channels reverse simultaneously. This has played out with remarkable consistency across every non-QE oil price cycle since 2005.
02 The Transmission Mechanism
The negative relationship operates through three well-established channels that FIIs explicitly monitor when allocating to Indian equities. Understanding these channels is essential to distinguishing when the relationship will hold versus when it may be temporarily overridden.
01 Current Account Deficit (CAD)
India imports approximately 85% of its crude oil requirements. Every $10/bbl rise in Brent adds roughly $12–15 billion to India’s annual import bill, directly widening the Current Account Deficit. A deteriorating CAD signals macro instability — FIIs price this as higher country risk and typically respond with equity outflows. The CAD sensitivity is asymmetric: oil spikes widen it rapidly, but the adjustment on the way down is slower as import hedges unwind.
02 INR Depreciation Pressure
Higher oil prices increase USD demand for import payments, putting direct downward pressure on the Indian Rupee. A weakening INR erodes USD-denominated returns for foreign investors. A $5B equity position returning 15% in INR terms may deliver only 8–10% in USD if the currency depreciates 5–7%. When Brent spikes, FIIs face a double headwind: equity valuation pressure and currency loss simultaneously. The INR’s correlation with Brent has been consistently negative throughout the dataset.
03 Inflation & RBI Policy Response
Crude oil feeds directly into India’s CPI basket through fuel, transport costs and food production inputs. A Brent spike raises domestic inflation, constraining the RBI’s ability to cut rates. Higher-for-longer rates compress equity valuations, particularly for rate-sensitive sectors (financials, real estate, consumer discretionary), which represent a large share of FII holdings in India. Conversely, falling oil gives the RBI room to cut — a positive catalyst for equity re-rating.
Why The Relationship Strengthened Post-2020
After 2020, FIIs became significantly more active in Indian equity markets — FII AUM in India roughly doubled between 2019 and 2024. This amplified sensitivity means macro signals like Brent now move larger absolute dollar amounts. The channel mechanism is identical, but the amplitude has grown materially. This explains why the 2020–2026 correlation (–0.32) is the strongest sub-period in the entire dataset.
03 Data & Methodology
Daily FII net equity flow data (USD Mn) and Brent Crude spot prices from January 1999 to June 2026, sourced from exchange and market data feeds. For analysis, data is aggregated to monthly frequency: sum of daily FII flows; average of daily Brent prices per calendar month. Pearson correlation coefficients are computed on monthly series across defined sub-periods.
* Brent price methodology note: All Brent Crude prices in this report are monthly averages of daily spot prices, unless explicitly stated as daily prices. Using monthly averages (rather than month-end prices) smooths daily volatility and better represents the macro environment FIIs were operating in. Where a specific daily price is referenced (e.g. the 3 Jul 2008 daily peak of $146.1), it is clearly noted. All correlations, episode averages and threshold analysis use monthly averaged Brent data.
Why The Full-Period Correlation (–0.01) Should Not Be The Headline
The correlation across the entire 1999–2026 dataset is –0.01 — statistically near zero. This is a structural artefact of two distinct anomalous regimes, not evidence that no relationship exists. (1) Pre-Reform India 1999–2004: FII flows were tiny and oil had no macro relevance. (2) QE Era 2010–2014: coordinated global QE overrode all fundamental macro signals — Brent averaged $102–112 yet FII remained strongly positive. Removing these two periods reveals the true signal of –0.26 (non-QE combined) and –0.32 (post-COVID).
Correlation by Period
| Period | Correlation | Avg Brent | Months | QE? | Interpretation |
|---|---|---|---|---|---|
| 1999–2004 | +0.37 | $21 | 72 | No | Pre-reform India: FII flows tiny, oil linkage not established |
| 2005–2009 | –0.26 | $71 | 60 | No | India emerges as EM; GFC 2008 confirmed the link |
| 2010–2014 (QE) | –0.07 | $102 | 60 | Yes | Global QE flooded EMs: Brent $100+ yet FII strongly positive |
| 2015–2019 | –0.04 | $58 | 60 | No | Oil range-bound $45–85; Fed, USD & domestic factors dominated |
| 2020–2026 | –0.32 | $75 | 78 | No | Strongest period: largest FII base, clearest transmission |
| Non-QE Combined (2005–26) | –0.26 | $69 | 198 | No | Clean structural signal ex QE distortion |
| Full Period (1999–2026) | –0.01 | $66 | 330 | Mixed | Diluted by pre-reform era + QE override |
04 Regime-by-Regime Analysis
Breaking the 25-year dataset into five distinct market regimes reveals how the oil–FII relationship has evolved and why it appears different across sub-periods. The QE era stands out as a clear anomaly driven by an extraordinary macro override. In all other regimes, the directional relationship is consistently negative.
Regime 1 - Pre-Reform India (1999–2004) · Correlation +0.37
Positive correlation because India was a tiny, illiquid EM and oil had no macro relevance to FII allocation decisions. FII flows were driven purely by domestic reform narratives. Oil was at $10–25/bbl, far too low for CAD concerns to register. Exclude from structural analysis.
Regime 2 - India Emergence (2005–2009) · Correlation –0.26
The link established itself as India’s economy grew and oil import dependency became macro-relevant. The GFC in 2008 — Brent at $135, FII at –$12.9B — was the definitive confirmation. Post-GFC recovery equally dramatic: Brent fell to $43, FII surged to +$17.6B. A $30.5B swing in a single year established the relationship beyond reasonable doubt.
Regime 3 - QE Era (2010–2014) · Correlation –0.07 · Exception
The clearest anomaly. Brent averaged $102–112 for five straight years, yet FII flows were strongly positive (+$24.5B, +$19.8B, +$16.2B). Coordinated QE by the Fed, ECB, BoJ, and Bank of England flooded all EMs with liquidity, overwhelming the oil headwind. Critically, even during QE, the Arab Spring of 2011 (Brent $110+ full year, FII –$0.5B) shows the oil signal tried to assert itself, demonstrating that even in a QE environment, sufficiently extreme oil shocks can partially break through. This regime is the primary reason the full-period headline correlation is misleading.
Regime 4 - Post-QE / Oil Bust (2015–2019) · Correlation –0.04
Oil range-bound $32–86, limiting its signal power. The 2018 spike to $86 produced –$4.6B FII outflow, confirming the channel still worked, while the 2015–16 oil bust produced modest inflows. The near-zero correlation reflects a range-bound environment where oil is present but not the dominant variable. Other factors (Fed tightening cycle, USD strength, domestic demonetisation) competed for signal dominance.
Regime 5 - Post-COVID (2020–2026) · Correlation –0.32 · Strongest Period
The strongest and most relevant period. Largest FII base, clearest macro transmission. Russia–Ukraine (Brent $117 → FII –$4.7B/mo), the 2023 same-year oscillation ($75 Brent → +$6.7B, $95 Brent → –$2.7B), and the 2026 spike (Brent $104 → –$14.2B worst month ever) all confirm the relationship operating at full amplitude. This is the regime that matters most for current and forward-looking analysis.
05 The 20-Year View (2004–2026)
Monthly FII flows (green = inflow month, red = outflow month) overlaid with Brent Crude prices. The inverse relationship is visible across every major oil price cycle. Note the QE era (2010–2014) as the visible exception — Brent elevated yet bars largely positive.
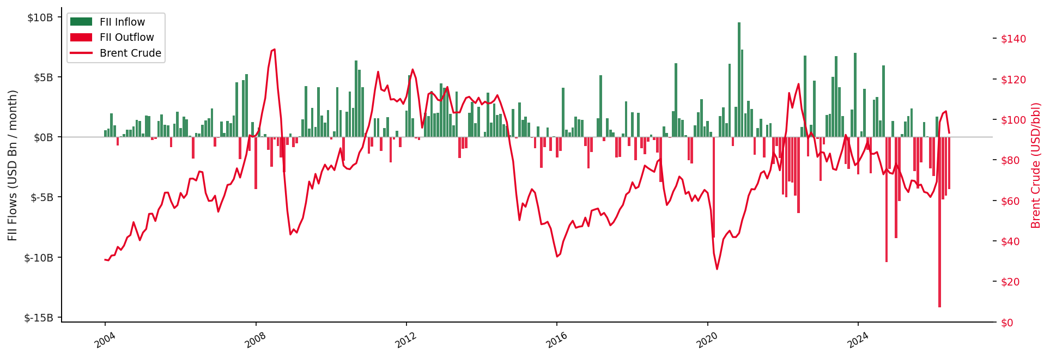
Chart 1: Monthly FII Flows (USD Mn) vs Brent Crude (USD/bbl) — January 2004 to June 2026. Green bars = inflow months; Red bars = outflow months. Red line = Brent Crude price (right axis).
06. Annual Summary (2004–2026)
Aggregating to an annual view removes monthly noise. Yellow rows = QE Era override (2010–2014). In all non-QE years, the directional relationship between Brent and FII direction is consistent.
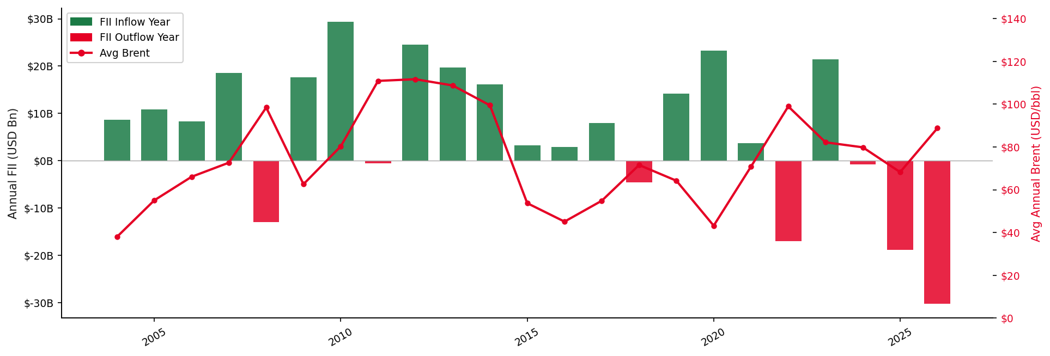
Chart 2: Annual FII Flows (USD Bn) vs Average Annual Brent Crude (USD/bbl), 2004–2026. Red bars = net outflow years. Yellow highlight = QE-era override.
Annual Data Table
| Year | Avg Brent | Annual FII | Direction | Notes |
|---|---|---|---|---|
| 2007 | $72.7 | +$18.5B | Inflow | Pre-GFC boom; oil below $90 — FII confidence high |
| 2008 | $98.4 | –$12.9B | Outflow | Brent peaked $134.7 (Jul); GFC panic — worst year to that date |
| 2009 | $62.6 | +$17.6B | Inflow | Oil crashed post-Lehman; $30.5B swing in a year |
| 2010 | $80.3 | +$29.3B | Inflow | Best FII year ever; stable moderate oil |
| 2011 | $110.9 | –$0.5B | QE Override | Arab Spring — avg $110.9 all year; monthly peak $123.5 (Apr 2011); oil broke through QE partially |
| 2012 | $111.7 | +$24.5B | QE Override | Brent $112 yet FII +$24.5B — QE dominated |
| 2013 | $108.8 | +$19.8B | QE Override | QE continued to override $109 Brent |
| 2014 | $99.5 | +$16.2B | QE Override | Brent declining from peak; QE still supportive |
| 2015 | $53.7 | +$3.3B | Inflow | Oil bust — India beneficiary |
| 2016 | $45.1 | +$2.9B | Inflow | Low oil supportive; demonetisation drag |
| 2017 | $54.9 | +$8.0B | Inflow | Moderate oil; solid recovery year |
| 2018 | $71.6 | –$4.6B | Outflow | Oct avg $80.5; FIIs exited within weeks |
| 2019 | $64.2 | +$14.2B | Inflow | Oil eased; strong FII recovery |
| 2020 | $43.2 | +$23.3B | Inflow | COVID crash then recovery on stimulus |
| 2021 | $70.8 | +$3.8B | Inflow | Partial recovery; modest positive year |
| 2022 | $99.0 | –$17.0B | Outflow | Russia–Ukraine; Brent $117 in June |
| 2023 | $82.2 | +$21.4B | Inflow | Oil moderated; biggest recovery since 2010 |
| 2024 | $79.8 | –$0.8B | Outflow | Marginally negative; Brent near threshold |
| 2025 | $68.2 | –$18.8B | Outflow | Macro headwinds despite lower oil; EM risk-off |
| 2026* | $88.8 | –$30.3B | Outflow | Jan–Feb avg $64–69; spike from Mar onwards ($99–104); worst year on record (YTD Jun 2026) |
* 2026 data through June 2026 only. Amber rows = QE Era 2010–2014.
07 Episode-by-Episode Analysis
Eleven specific historical episodes selected around major Brent Crude inflection points. Each independently confirms the directional relationship between oil and FII flows.
Episode Summary Table
| Episode | Period | Avg Brent | Total FII | Avg FII/mo | Dir. |
|---|---|---|---|---|---|
| Pre-GFC Boom | 2007 | $72.7 | +$18.5B | +$1.5B/mo | In |
| GFC Crash | 2008 | $98.4 (pk $135) | –$12.9B | –$1.1B/mo | Out |
| Post-GFC Recovery | 2009 | $62.6 | +$17.6B | +$1.5B/mo | In |
| Arab Spring | 2011 | $110.9 | –$0.5B | –$43M/mo | Out |
| Oil Bust | 2015–Jun16 | $49.5 | +$6.2B | +$345M/mo | In |
| 2018 Spike | Sep–Dec18 | $70.8 (Oct $80.5) | –$3.9B | –$970M/mo | Out |
| Russia–Ukraine | Feb–Jun22 | $108.5 | –$23.7B | –$4.7B/mo | Out |
| Post-War Recovery | Jul–Dec22 | $93.3 | +$11.5B | +$1.9B/mo | In |
| 2023 H1 Inflows | Apr–Jul23 | $78.5 | +$17.8B | +$4.5B/mo | In |
| 2023 Q3 Outflows | Sep–Oct23 | $90.5 | –$4.9B | –$2.5B/mo | Out |
| 2026 Spike YTD | Jan–Jun26 | $88.8 | –$30.3B | –$5.0B/mo | Out |
Episode 1 — Pre-GFC Boom & Crash (2007–2009): The $30B Swing
In 2007, as monthly avg Brent rose from $54 to $89 (still below the critical $90 threshold), FII flows were a healthy +$18.5B. As Brent surged to a monthly avg of $134.6 in July 2008 (daily peak: $146.1 on 3 Jul 2008), FII flows collapsed to –$12.9B for the full year. As Brent crashed from $134 to $43 monthly avg in the post-Lehman period, FII flows surged to +$17.6B in 2009, a $30.5B swing in a single year that definitively established the relationship.
Episode 2 — Arab Spring (2011): Annual Avg Brent $110.9, Monthly Peak $123.5
Same India macro story, same global QE backdrop as 2010 — only the oil price changed. Monthly avg Brent averaged $110.9 for the full year, with a peak monthly avg of $123.5 in April 2011. Annual FII swung from +$29.3B in 2010 to –$0.5B in 2011, a –$29.8B year-on-year move. Critically, even with active QE in 2011, the sustained high monthly avg Brent partially broke through the liquidity support.
Episode 3 — Oil Bust (2014–2016): 76% Price Decline
Brent fell from $115 to a trough of $27 in January 2016, a 76% collapse over 18 months driven by US shale supply and OPEC’s production decision. India was an unambiguous beneficiary: lower CAD, stronger INR, RBI rate cuts enabled. FII flows were positive in 2015 (+$3.3B) and 2016 (+$2.9B) despite broader global EM turbulence.
Episode 4 — 2018 Brent Spike: Reaction Time Under 60 Days
Monthly avg Brent rose from $57 to a peak of $80.5 in October 2018. Annual FII turned –$4.6B in 2018 from +$8B in 2017. When monthly avg Brent fell back to $57.7 by December 2018, FIIs began returning quickly: February 2019 saw +$2.2B inflow, confirming the recovery in FII direction within 60 days of oil easing.
Episode 5 — Russia–Ukraine War (Feb–Jun 2022): –$23.7B in 5 Months
Russia’s invasion of Ukraine triggered a sustained oil supply shock. Brent surged from $89 in January to $117.5 in June 2022. Over the five-month period Feb–Jun 2022, FII flows averaged –$4.7B per month, totalling –$23.7B cumulatively. June 2022 alone: –$6.3B — the worst single month since the GFC. When Brent eased toward $80 in August 2022, FII swung to +$6.8B — a $13B reversal in 60 days.
Episode 6 — 2023 Same-Year Oscillation: The Natural Experiment
2023 provides a textbook within-year experiment: same calendar year, same India macro story, same global backdrop — oil price was the sole swing variable. When Brent eased to $75 in May–June, FII hit +$5.0B and +$6.7B/mo. When Brent rebounded to $90–95 in September–October, FII turned negative at –$2.3B to –$2.7B/mo.
Episode 7 — 2026 Spike: Worst Year on Record
After a moderate start to 2026 (monthly avg Brent $64–69 in January–February), monthly avg Brent surged to $98.6 in March, $102.9 in April, and $104.0 in May 2026, driven by OPEC+ production cuts and renewed geopolitical risk premium. March 2026 saw –$14.2B, the largest single-month outflow in the entire 25-year dataset, surpassing both GFC and Russia–Ukraine months. Year-to-date 2026 FII outflows stand at –$30.3B, on track to be the worst calendar year on record. The YTD avg Brent of $88.8 understates the spike severity as the impact was concentrated in the March–May period.
08. The Recent Cycle in Detail (2020–2026)
The post-COVID period provides the clearest running confirmation of the relationship. Three major dislocation events: the COVID crash (March–April 2020), the Russia–Ukraine war (February–June 2022), and the current 2026 spike are highlighted below.
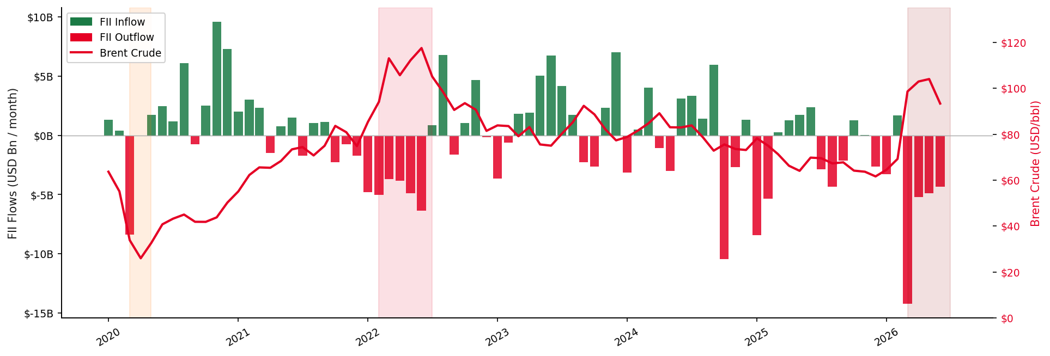
Chart 3: Monthly FII Flows vs Brent Crude — January 2020 to June 2026. Shaded bands mark the three major oil shock episodes. The inverse relationship is most clearly visible in the 2022 and 2026 episodes.
09. Scatter Analysis — All Monthly Data (2004–2026)
Every calendar month from January 2004 to June 2026 plotted with Brent Crude on the x-axis and monthly FII flows on the y-axis. The downward-sloping OLS trend line confirms the negative directional relationship. The relationship is most pronounced at the extremes: months where Brent exceeded $90/bbl cluster disproportionately in outflow territory.
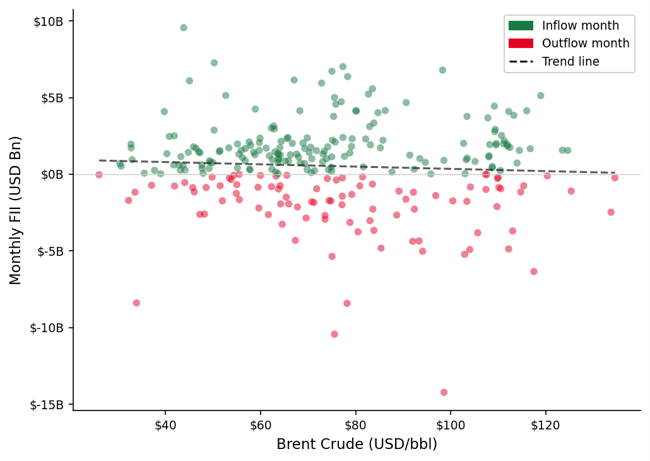
Chart 4: Scatter — monthly Brent Crude ($/bbl) vs FII flows (USD Bn), 2004–2026. Red = outflow month; Green = inflow month. Dashed line = OLS linear trend.
Brent Price Range — FII Flow Statistics
| Brent Range | N Months | Avg Brent | Avg FII/mo | % Outflow | Signal |
|---|---|---|---|---|---|
| Below $50 | 105 | $32.2 | +$0.37B | 25% | Strong inflow bias — CAD benign, INR stable, RBI can cut |
| $50–$75 | 106 | $63.8 | +$0.72B | 31% | Moderate inflow bias — supportive, other factors dependent |
| $75–$90 | 47 | $80.4 | +$0.82B | 40% | Mixed / transition zone — oil not decisive |
| $90–$110 | 45 | $102.1 | –$0.20B | 44% | Outflow bias — CAD stress, INR pressure, RBI constrained |
| Above $110 | 8 | $120.3 | –$2.40B* | 88% | Severe outflow — crisis-level CAD stress, RBI unable to act |
* The “Above $110” bucket excludes QE-era (2010–2014) months. Including QE, avg FII/mo = +$0.53B — a statistical artefact of coordinated global liquidity overriding the oil-macro transmission channel.
10 Nuances, Exceptions & Limitations
The 2012–2014 QE Exception
As documented in Section 04, coordinated QE by the Fed, ECB, Bank of England and Bank of Japan created a regime where global liquidity overwhelmed the oil–India macro linkage. Brent averaged $102–112 for three consecutive years yet FII remained strongly positive. This is the single most important caveat and is reflected in the regime-adjusted correlation framework. Key lesson: the oil–FII relationship can be overridden, but only by an equally powerful and simultaneous counter-force across all major central banks. Such episodes are rare.
COVID-19 March 2020 — Demand Shock Anomaly
In March–April 2020, both Brent and FII collapsed simultaneously, an apparent deviation from the normal inverse pattern. This was driven by a global demand collapse (oil crashed from $63 to $26) rather than a supply shock, creating synchronised risk-off deleveraging across all asset classes. The oil–FII inverse relationship requires oil to be the source of stress, not a co-victim of a broader shock. The underlying mechanism reasserted itself by May 2020 when Brent stabilised and FIIs began returning aggressively.
October 2024 — Non-Oil Exception
October 2024 was the second worst FII month in the entire 25-year dataset at –$10.4B, yet monthly avg Brent was only $75.6 — well below the $90 threshold. This was driven by global macro factors (USD strength, EM risk-off, domestic equity valuation concerns) rather than oil. It is an important reminder that while the oil–FII relationship is structural, other macro drivers can produce severe outflows even in a moderate oil environment. The 2024 full-year avg Brent of $79.8 was in the middle of the mixed zone, and the year ended slightly negative (–$0.8B overall).
2025 Outflows Despite Lower Oil
2025 saw FII outflows of –$18.8B despite Brent averaging a relatively moderate $68.2/bbl. This reflects amplification from global USD strength, broader EM risk-off tied to geopolitical uncertainty, and India-specific factors rather than oil. It confirms that while the oil channel is structural, other variables can dominate in specific periods, particularly when Brent is in the $60–80 range where its signal is weakest.
11 Conclusion & Practical Framework
This analysis establishes a consistent, structurally grounded negative relationship between Brent Crude oil prices and FII equity flows into Indian markets. The relationship is observable across every major oil price cycle from 2005 to the present, with the notable exception of the 2010–2014 QE era when central bank liquidity overrode all fundamental macro signals.
The transmission mechanism is well-defined and operates through three reinforcing channels — CAD deterioration, INR depreciation and RBI policy constraint — all of which activate simultaneously when Brent rises above ~$90/bbl and reverse when oil falls below ~$75/bbl.
As of June 2026, with monthly avg Brent at $93.3 in June (after $99–104 in March–May), the data suggests continued but potentially easing FII pressure on Indian equities. A sustained move below $80/bbl monthly avg, with no new global risk events, would historically be the most reliable leading indicator for a meaningful FII recovery.
Brent Price Framework — FII Bias by Regime
The relationship is structural but not unconditional. The 2026 episode — the worst FII year on record, driven by a Brent spike to $104 — is the latest confirmation of a pattern that has repeated for two decades. As oil eases from its peak, the historical template points to a re-entry trade of substantial magnitude, consistent with the post-2009, post-2016 and post-2022 recoveries.


.png)

.png)

.png)