A Middle East war, an oil curve that snapped violently higher, and a Fed boxed in by prices running hot. Real yields stayed elevated, the dollar found bids on hike odds, and gold and silver gave back most of the November–January rally. On our reading, this fear is now fading, not gone.
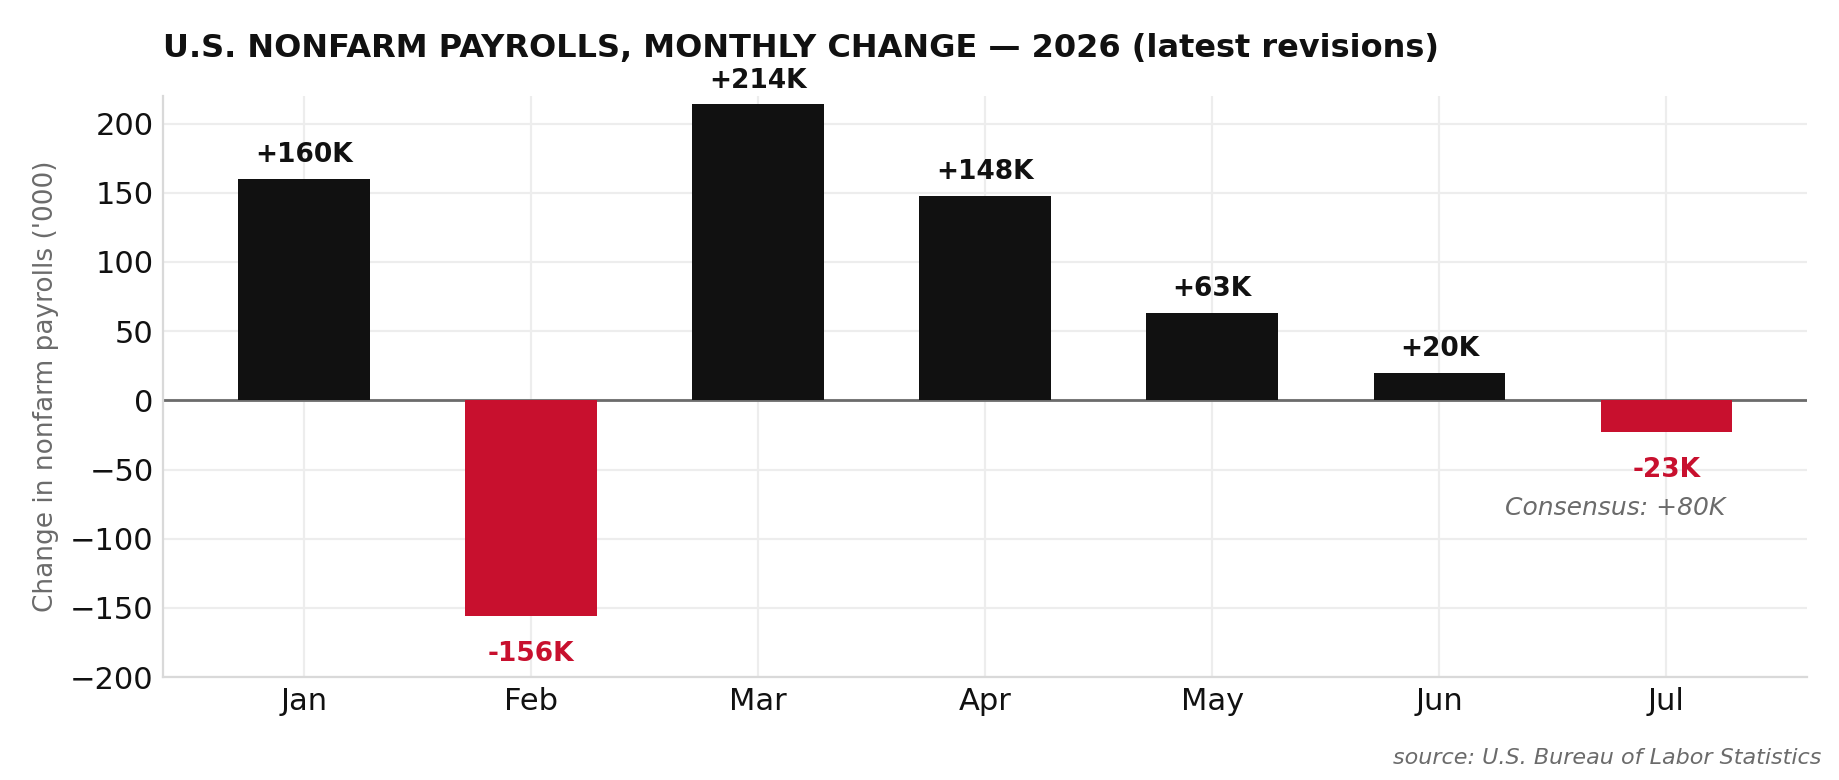
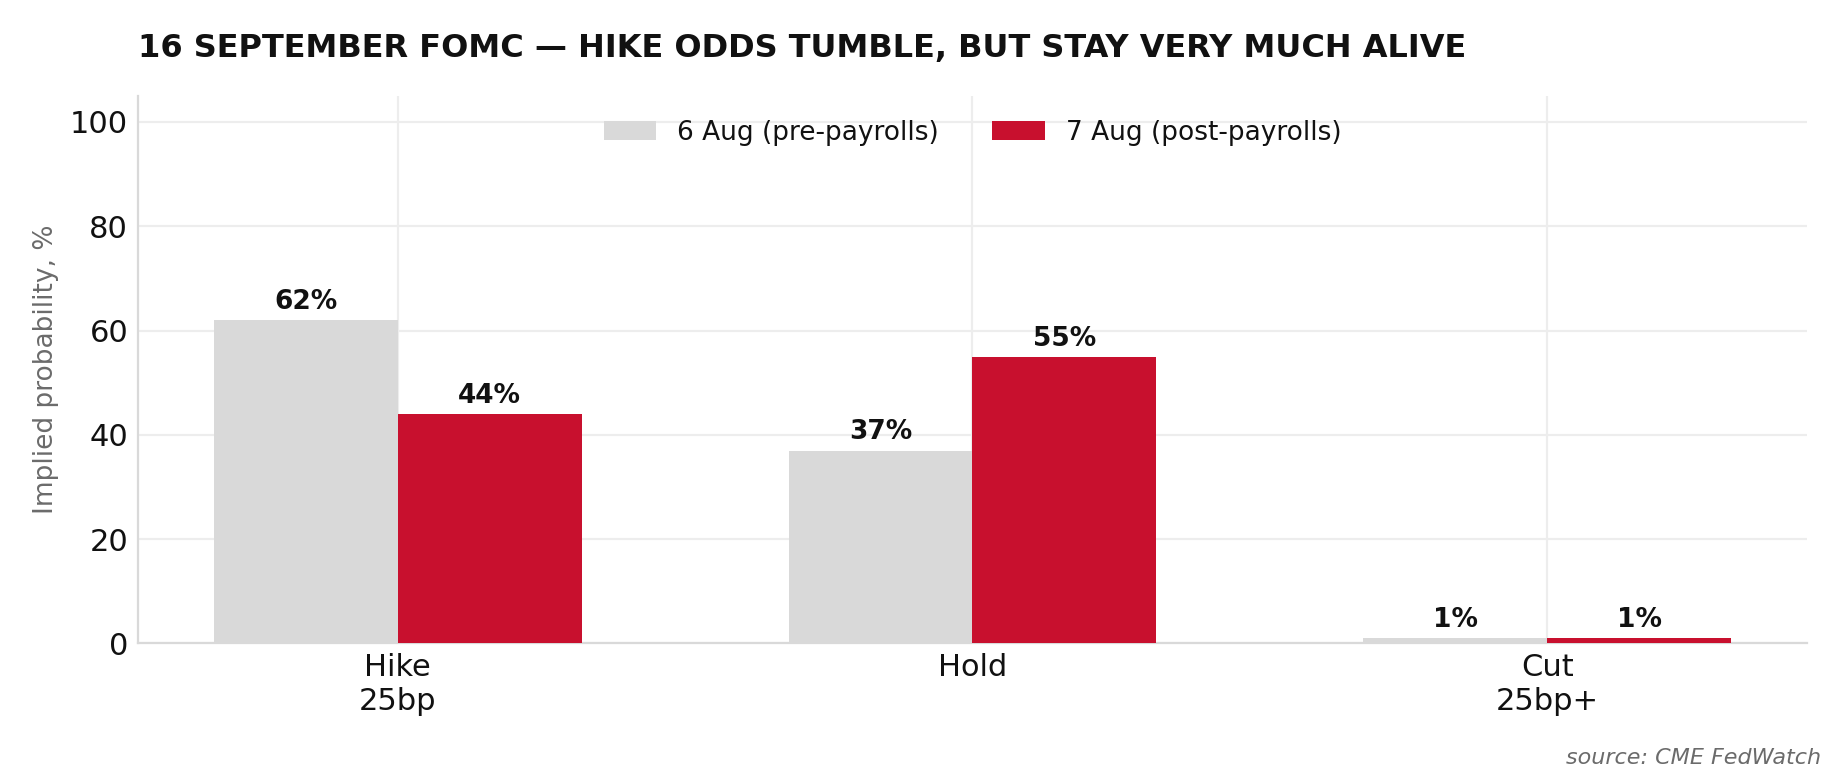
July payrolls fell 23,000 against +80,000 expected, with over 100,000 in downward revisions layered on top. A Fed that was pricing a September hike as recently as 6th August is now far less sure of itself: hike odds have fallen to 44% and a hold is now the marginally favoured outcome. Same war, same oil market, opposite policy conclusion.
Markets have spent five months trading one fear for another, and gold and silver are the cleanest expression of the swap. From late February, the story was inflation: a war in the Middle East, an oil curve that snapped violently higher, and a Federal Reserve boxed in by prices running above target. That fear is bad for precious metals, a non-yielding currency asset loses its edge when real yields and the dollar both stay bid on hike odds. Gold and silver duly gave back almost the entirety of the rally that began in November 2025.
On 7th August the fear changed shape. A shock jobs report flipped the Fed's reaction function inside a single session, and a growth fear is precisely the environment gold and silver have been waiting for. The charts, after a near two-month base, are voting with their feet.
The fear that broke them
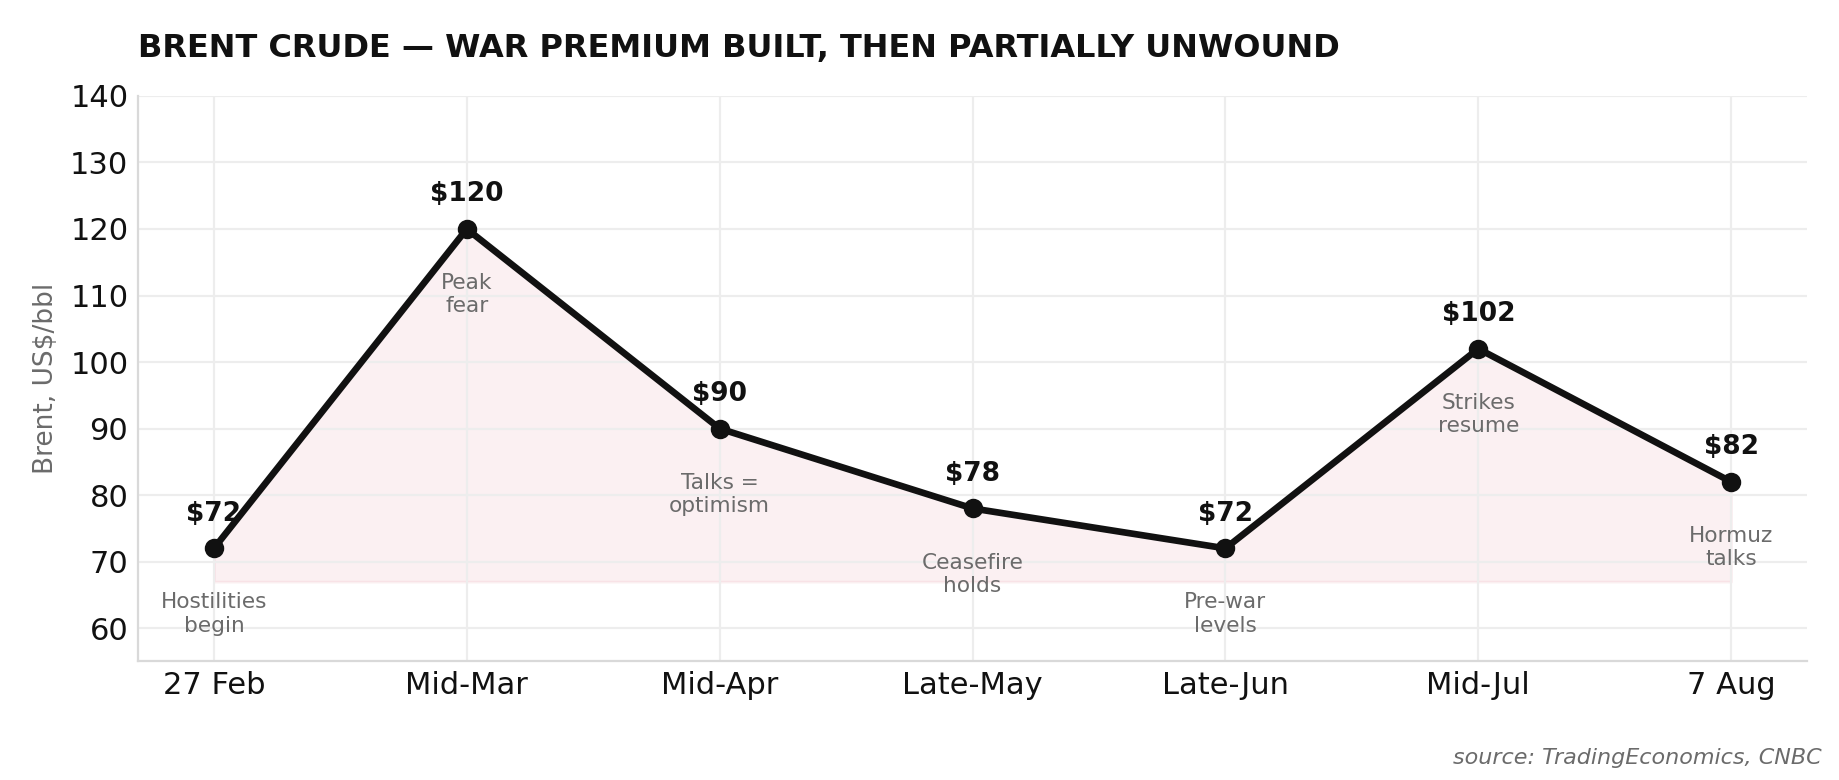
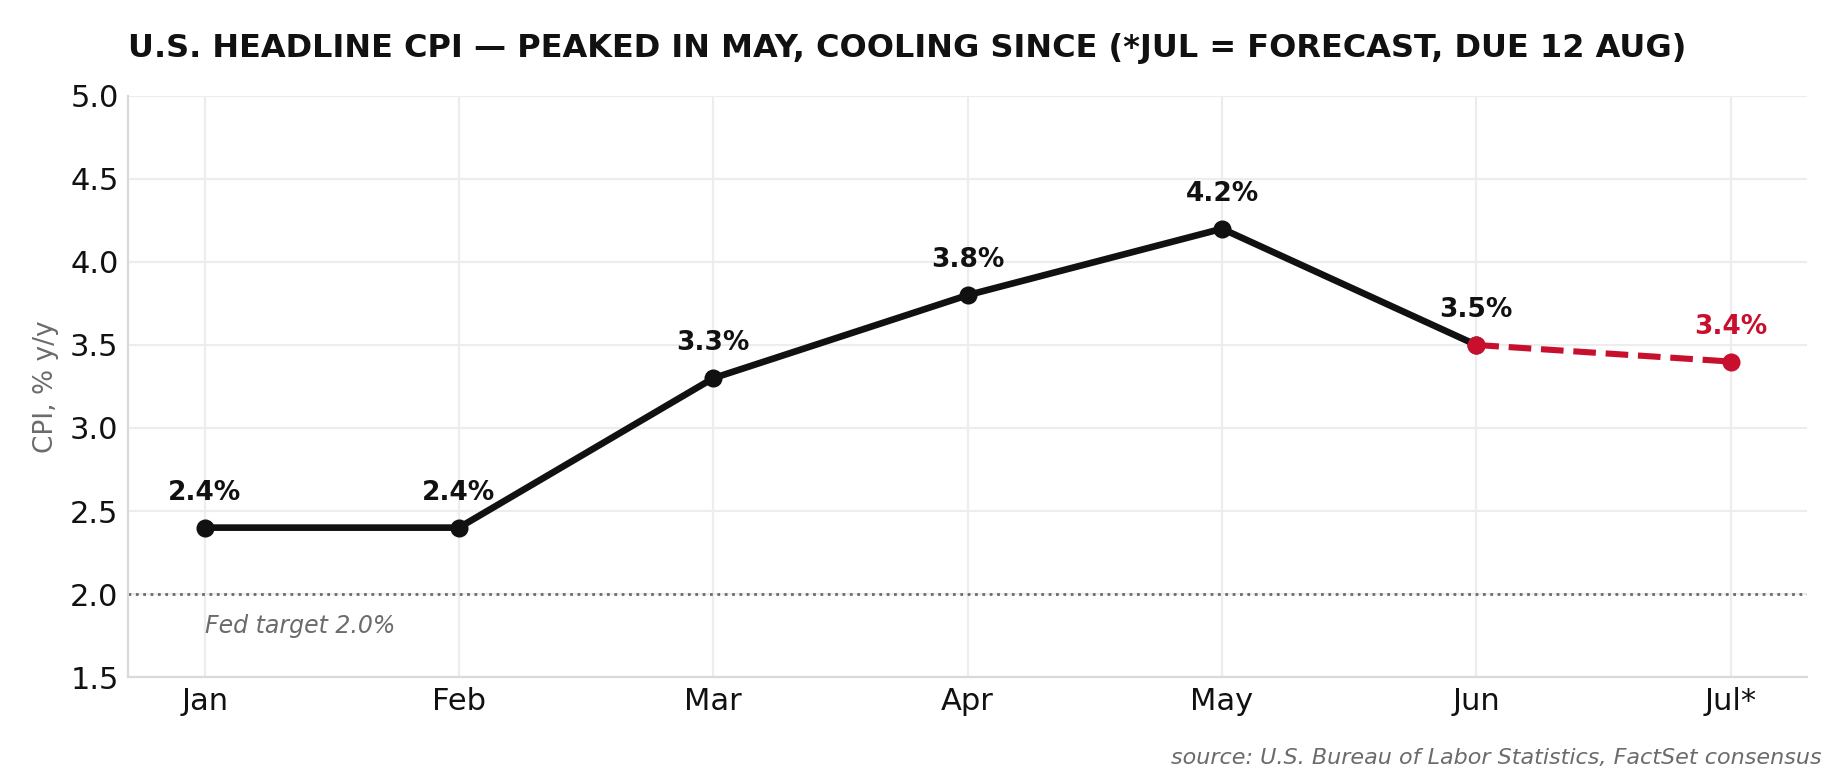
Gold peaked near $5,627 and silver near $121.77 in late January, at the top of a rally built on currency-diversification demand for gold and supply-deficit dynamics for silver. Both fell almost in a straight line from early March, in near lockstep with the Middle East conflict that began on 28th February. Brent crude jumped from roughly $72 a barrel before the war to a peak near $120 in mid-March, then whipsawed on every ceasefire headline and every relapse, most recently spiking to $102 in late July before easing back. Headline CPI followed with a lag, accelerating from 2.4% in February to 4.2% in May, the hottest print since 2023, with energy doing the damage.
The Fed's response defined the next five months. Rather than easing into a growth wobble, the FOMC under Chair Kevin Warsh held its policy rate at 3.50–3.75% through five consecutive meetings, including the 29th July decision. By 6th August, futures markets had priced a 62% probability of a 25bp hike at the 16th September meeting, up from close to zero in March. That is the environment precious metals hate: inflation elevated enough to keep the Fed hawkish, real yields high, the dollar bid. Gold and silver gave back the bulk of their gains, silver alone shedding more than half its value from the January peak to the summer low.
The fear that flipped them
The narrative was already cracking before the jobs number landed. Headline CPI eased to 3.5% in June from May's 4.2%, the first decline in five months, as the energy pass-through from the war began to fade. Then on 7th August the labour market did the rest. Nonfarm payrolls fell 23,000 in July against a forecast gain of roughly 80,000, and the Bureau of Labor Statistics revised May and June down by a combined 103,000, the latest in a run of revisions that has moved almost every print this year. That is not a resilient labour market shrugging off a war, it is one cracking under the weight of one.
Markets did the arithmetic in real time, but the result is a genuine two-way argument rather than a clean flip. A meeting that was decidedly tilted toward a hike on Thursday 6th August, priced at 62%, saw those odds fall to 44% by Friday's close according to CME FedWatch, with a hold now the marginally favoured outcome at 55% and an outright cut still barely priced. That is one of the sharpest single-session repricings of this cycle, but it is a shift from “hike” to “live meeting,” not from “hike” to “cut.” The dollar index slid to a seven-week low and the 10-year Treasury yield fell. Some desks, Bank of America among them, are still holding out for a hike later this year on inflation grounds, and a hike remains very much on the table for 16th September. What has changed is that a hold, or even a dovish hike, is now a live outcome for the first time since March.
This is the pivot that matters more than the war itself. The war supplied the oil shock and the inflation impulse that made the Fed cautious, and it has not gone away, Brent is still trading with a geopolitical premium. What changed is the growth side of the ledger. A Fed forced to choose between an inflation problem and a labour-market problem tends to lean toward the labour market at the margin, and every point that odds shift away from a hike is a tailwind for gold and silver, even before a single cut is delivered. Layer on a central-bank bid that never paused through the correction, the World Gold Council still forecasts roughly 850 tonnes of official-sector purchases for 2026, and the fundamental floor beneath this move is more solid than the June–July price action suggested.
What the tape is saying
Price action agrees with the fundamental pivot, and it agrees with unusual force. Both metals spent June and July carving out a base, roughly eight weeks of sideways, low-conviction trade after the March–April collapse, before the 7th August print produced the largest daily candle either market has printed since the sell-off began.
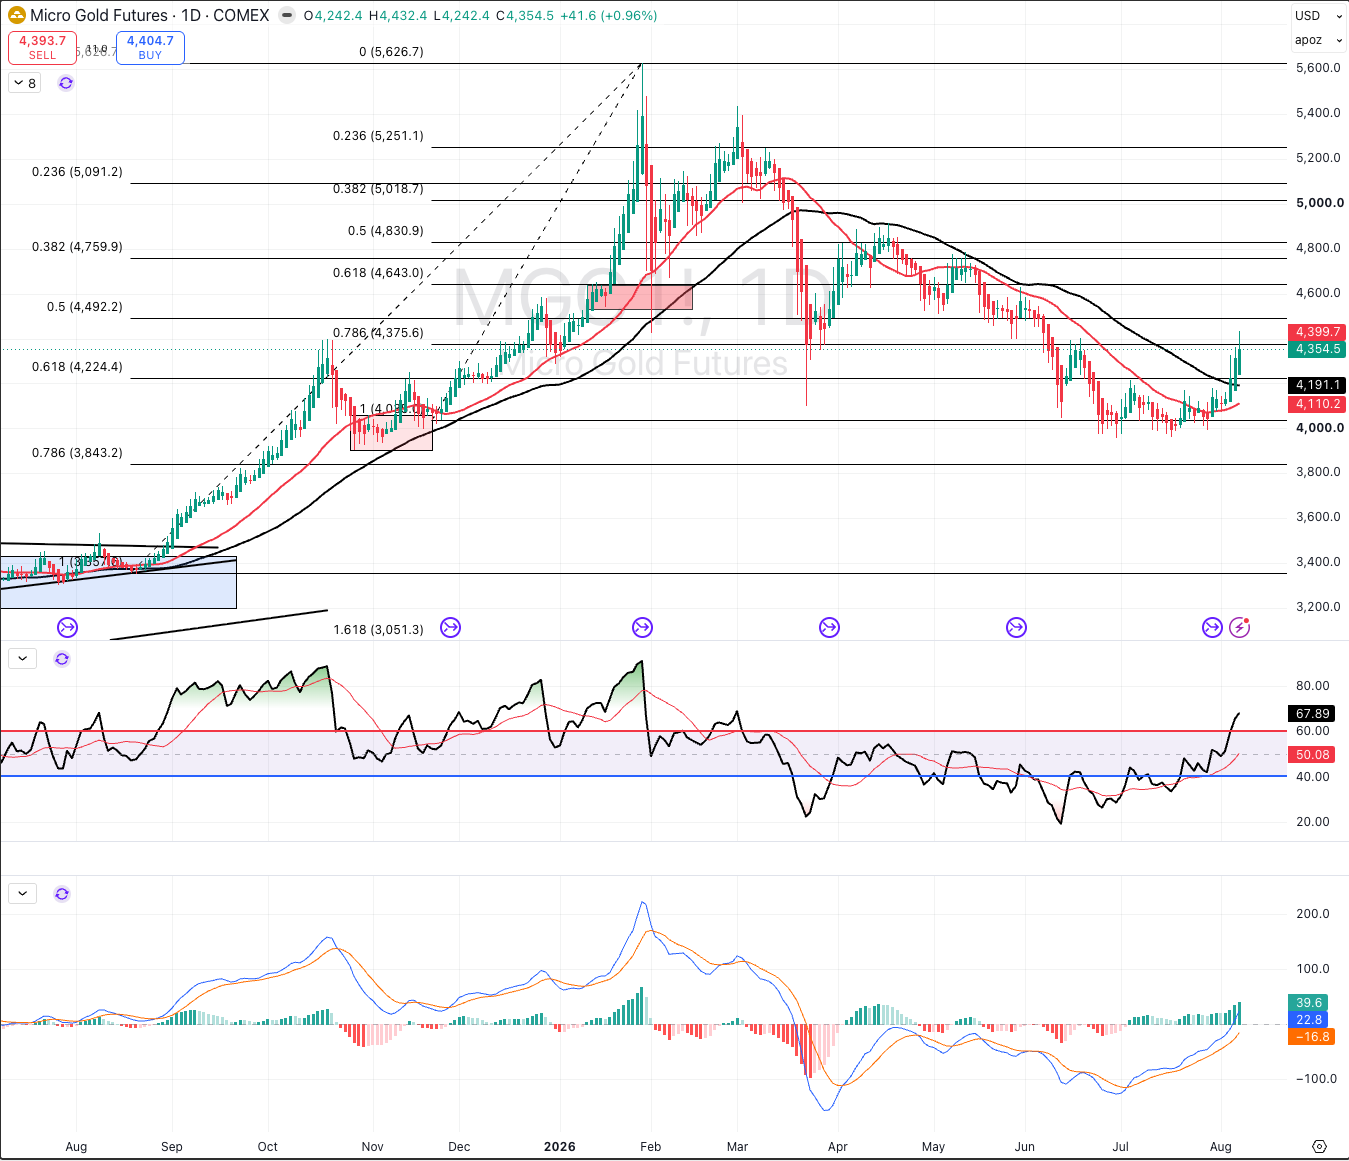
Gold's break is the cleaner of the two. The 7th August candle cleared both the 20- and 50-day EMAs (4,153 / 4,222) in a single session and pushed through the 0.786 retracement of the November–January rally at 4,375, a level that had capped every rally attempt since April. RSI has crossed back above 60 and MACD has flipped positive for the first time since the top. The next hurdle is the $4,750–4,800 area. The base itself, roughly 4,000–4,225, is now the line in the sand on any retest.
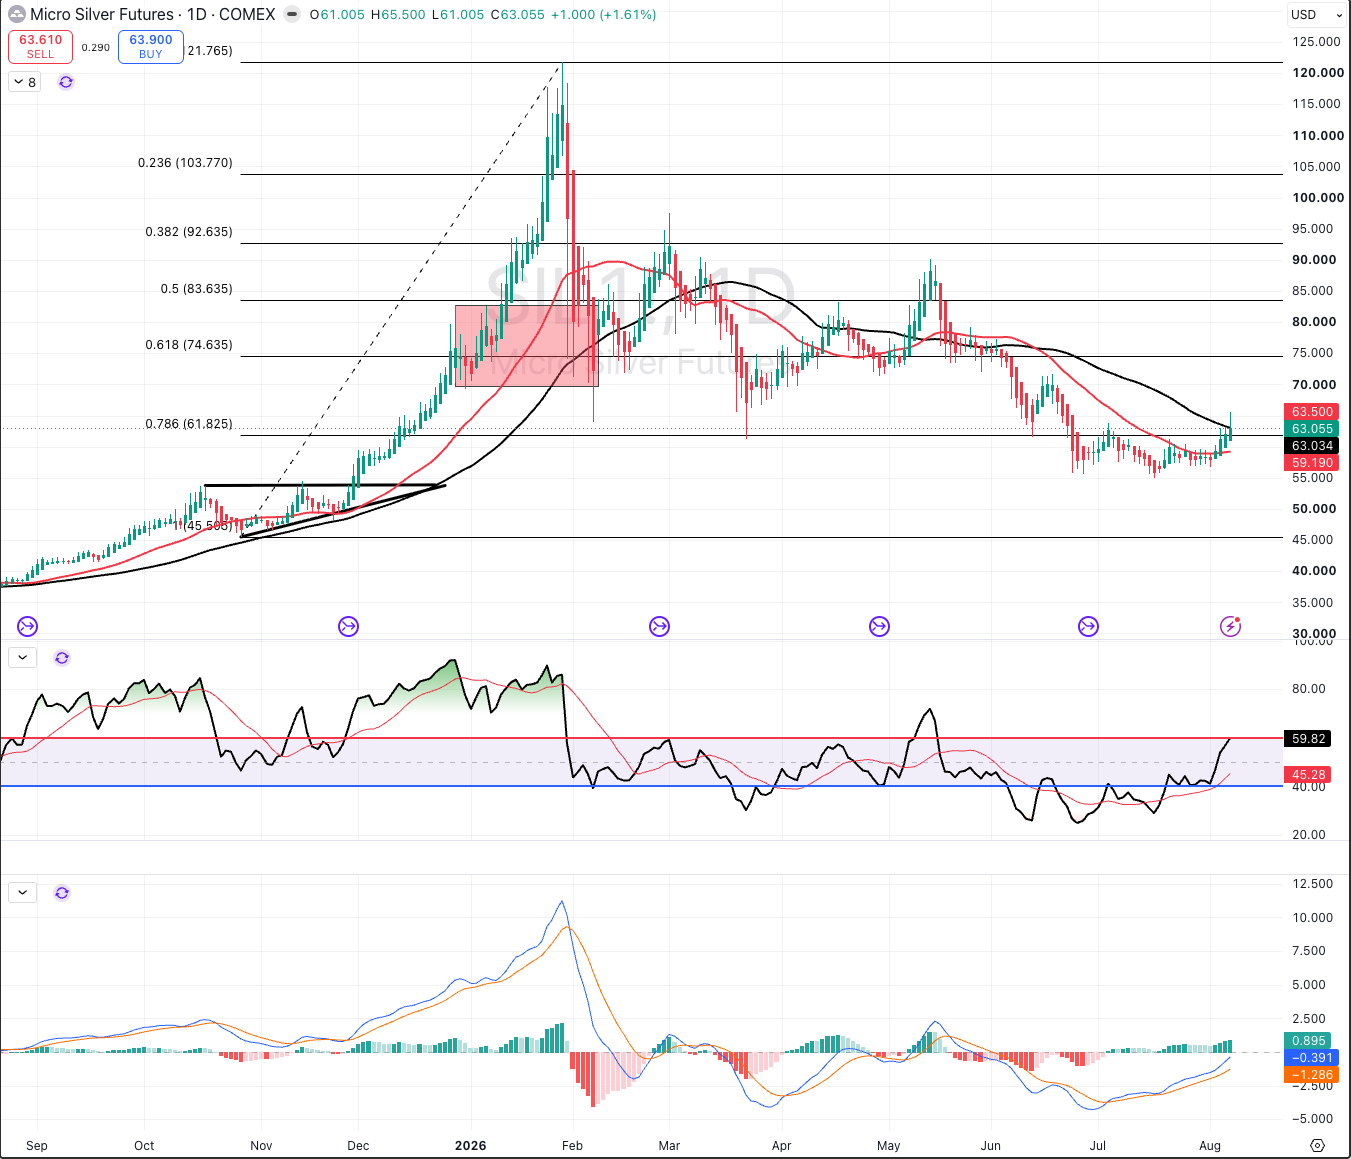
Silver's structure is a step behind gold's, which is normal for the higher-beta, more industrially-driven metal. The move cleared the 0.786 retracement at 61.8 but is still fighting through the 50-day EMA / Supertrend confluence at 63.2–63.3, exactly where price sits as we write. A daily close above 64 would confirm silver has cleared its own resistance shelf, below 61.8 the base is broken and the down-move resumes.
CONFIRM / DENY — WHAT HAPPENS NEXT
The head has done the arithmetic. Whether the tape keeps agreeing depends on a short list of things resolving in its favour.
CONFIRMATION SIGNALS
- 16 September FOMC stands pat and is dovish in commentary, rather than delivering the hike priced as recently as 6th August.
- Dollar index breaks decisively below the 99 handle rather than bouncing back.
- Central banks maintain 2026 buying through Q3 reporting, on top of the ~850t WGC forecast.
- Gold holds the 4,150–4,225 shelf and silver holds 61.8 on any retest of the base.
- Brent stays capped below $85 on progress in Hormuz talks, removing the stagflation tail that capped metals through Q2.
DENIAL SIGNALS
- August payrolls, due early September, rebound sharply and reopen the door to the hike priced pre-NFP.
- Hormuz talks collapse and Brent re-accelerates through $90–95, reviving the inflation-not-growth narrative that hurt gold from March.
- A daily close back below 4,150 gold or 61.8 silver invalidates the base outright.
- July CPI, due 12th August, surprises to the upside and forces the Fed's hand back toward hawkish.
- Hawkish FOMC voices gain sway under Chair Warsh, re-anchoring a higher-for-longer narrative.