


The Dichotomy - The Head says, stay selective. The Heart says, stay invested. Are both right? Respect the price. Honour the data.
Price action is the lead indicator, and it is bullish. The breakout to all-time highs is real, the momentum is real, and fighting that tape has been painful. Tactically, the bias should be to stay invested in areas where fundamentals support the price - quality technology, AI infrastructure, and markets structurally insulated from energy. While energy security and defence themes have struggled in recent times, these remain multi-year upside opportunities.
But this is also not the time for indiscriminate risk-taking. The macro foundation is not broad enough to support a generalised bull market. Energy, consumer (especially mass market), and rate-sensitive sectors carry fundamental headwinds that price has not yet fully absorbed.
Since US-Iran hostilities began on February 28th, markets have done something remarkable - and uncomfortable. Both the S&P 500 (7365) and the Nasdaq 100 (28599) have not only recovered their losses, but have surpassed their pre-war levels and currently at all-time highs. Over the same period, the macro backdrop has quietly but meaningfully worsened.
This is the dilemma for investors – the head and the heart are pointing in different directions. Price action, the heart is unambiguously bullish. Fundamentals, the head tell a more complicated story. While understanding this dichotomy, and how it resolves is critical, for now, trust the heart over the head.
What Price Action Is Saying
Markets are discounting mechanism. All-time highs are bullish, not noise, and deserve respect. What is driving this optimism? First, the Middle East conflict is increasingly being priced as a supply shock with a finite duration rather than a structural reset. Second, technology, the dominant force in major indices, is largely insulated from the macro, oil prices, consumer confidence, and the labour market. It is not cyclical in the traditional sense. Third, earnings have, at least for the largest names, continued to deliver with guidance continuing apace.
This is not irrational exuberance in a vacuum. It has a fundamental anchor. But that anchor is narrow, and needs participation to sustain.
S&P 500and Nasdaq 100 Scale All Time Highs
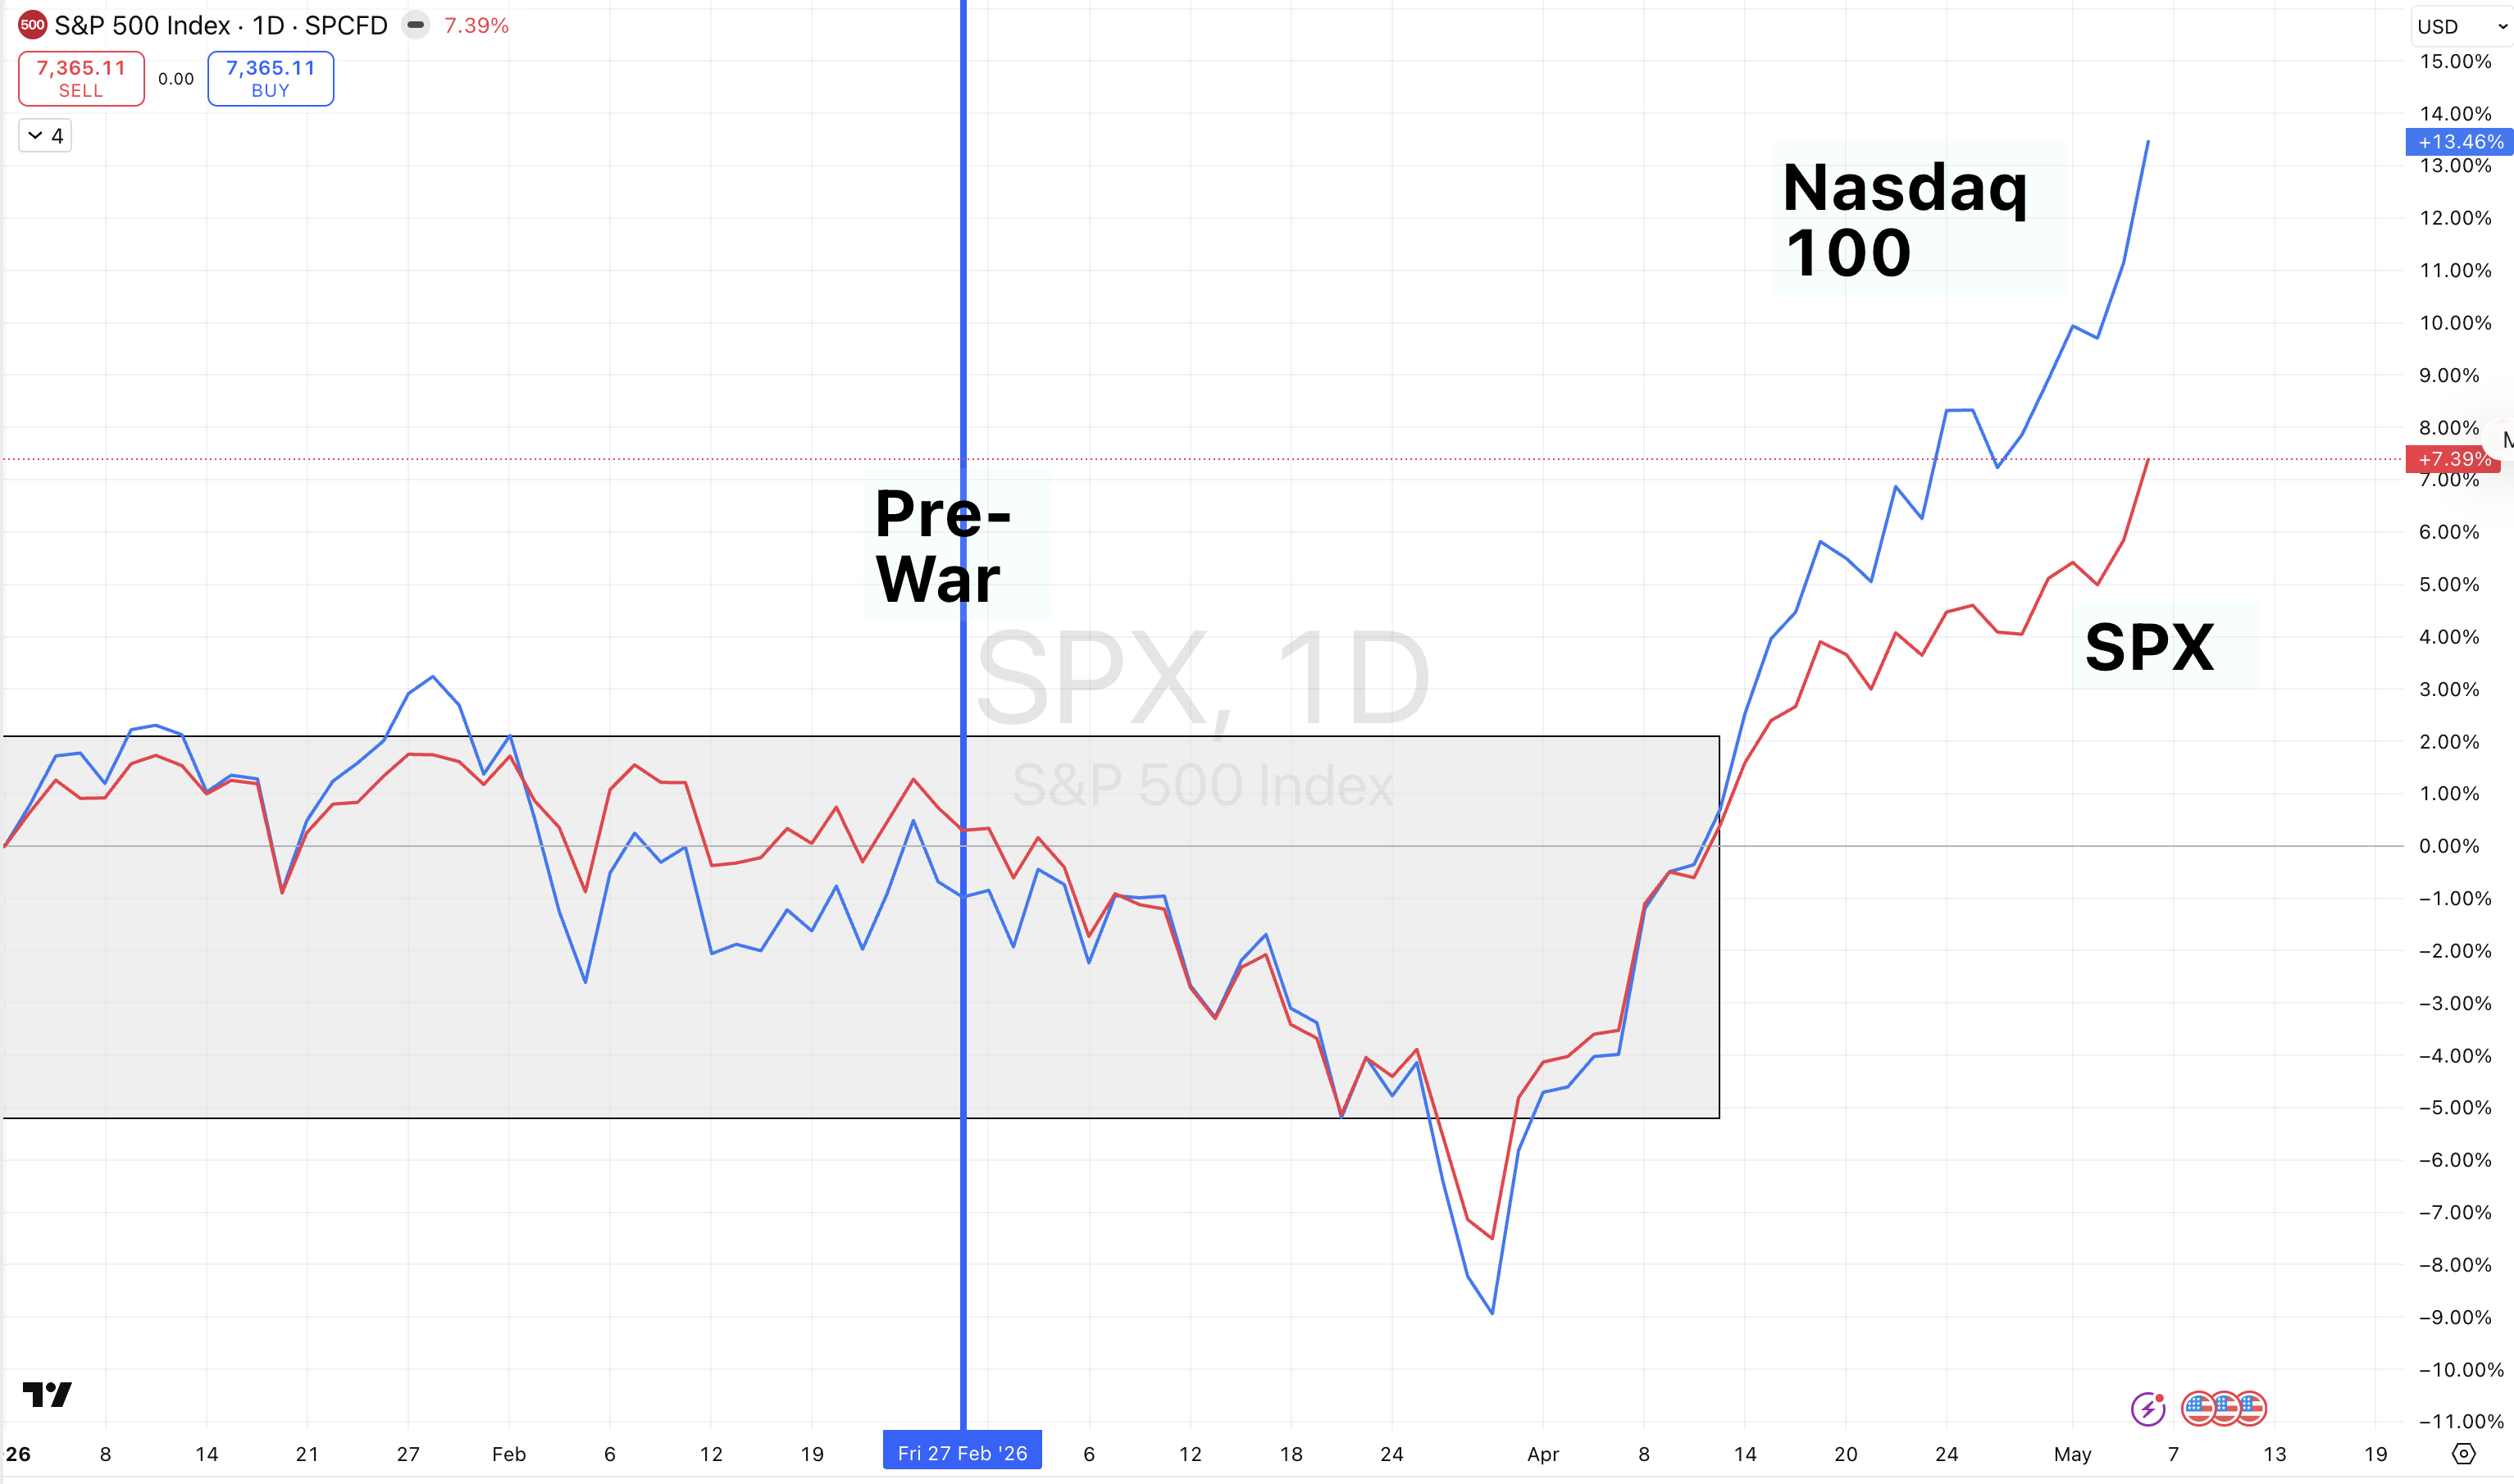
source:Trading View
The Narrow Passage
In our Q2 2026 Outlook, the Strait and Narrow we discussed the escape path for markets – narrow, but not straight – and for now, that appears to be playing out.
However, to understand just how narrow this path has been, consider the fact that half the sector indices are in the red since 27th Feb and 10 of the 11 sectors have underperformed S&P. Technology is the overwhelming driver and top 10 stocks account for all of the move (89% for Nasdaq 100) with the top 5 alone contributing between 60 and 67% of the move from 27th Feb. So yes, its animal spirits on the headline, just that the jungle is not joining in yet.
An then there is the question of breadth – 55% of S&P stocks are trading above their 50dma, much below the 70%+ associated with all time highs. The picture for Nasdaq 100 is not particularly different. This is not broad-based strength, rather concentrated leadership. Why does this matter? First,concentrated rallies are inherently fragile, if the leaders stumble, there is no breadth to absorb the shock. Second, it signals that the market is not pricing in a broad recovery. It is pricing in the continued resilience of a handful of technology businesses that happen to be macro-independent. Importantly though, this can change, but the jury is still out.
% ofS&P 500 stocks above 50dma - Breadth Not Yet Confirming
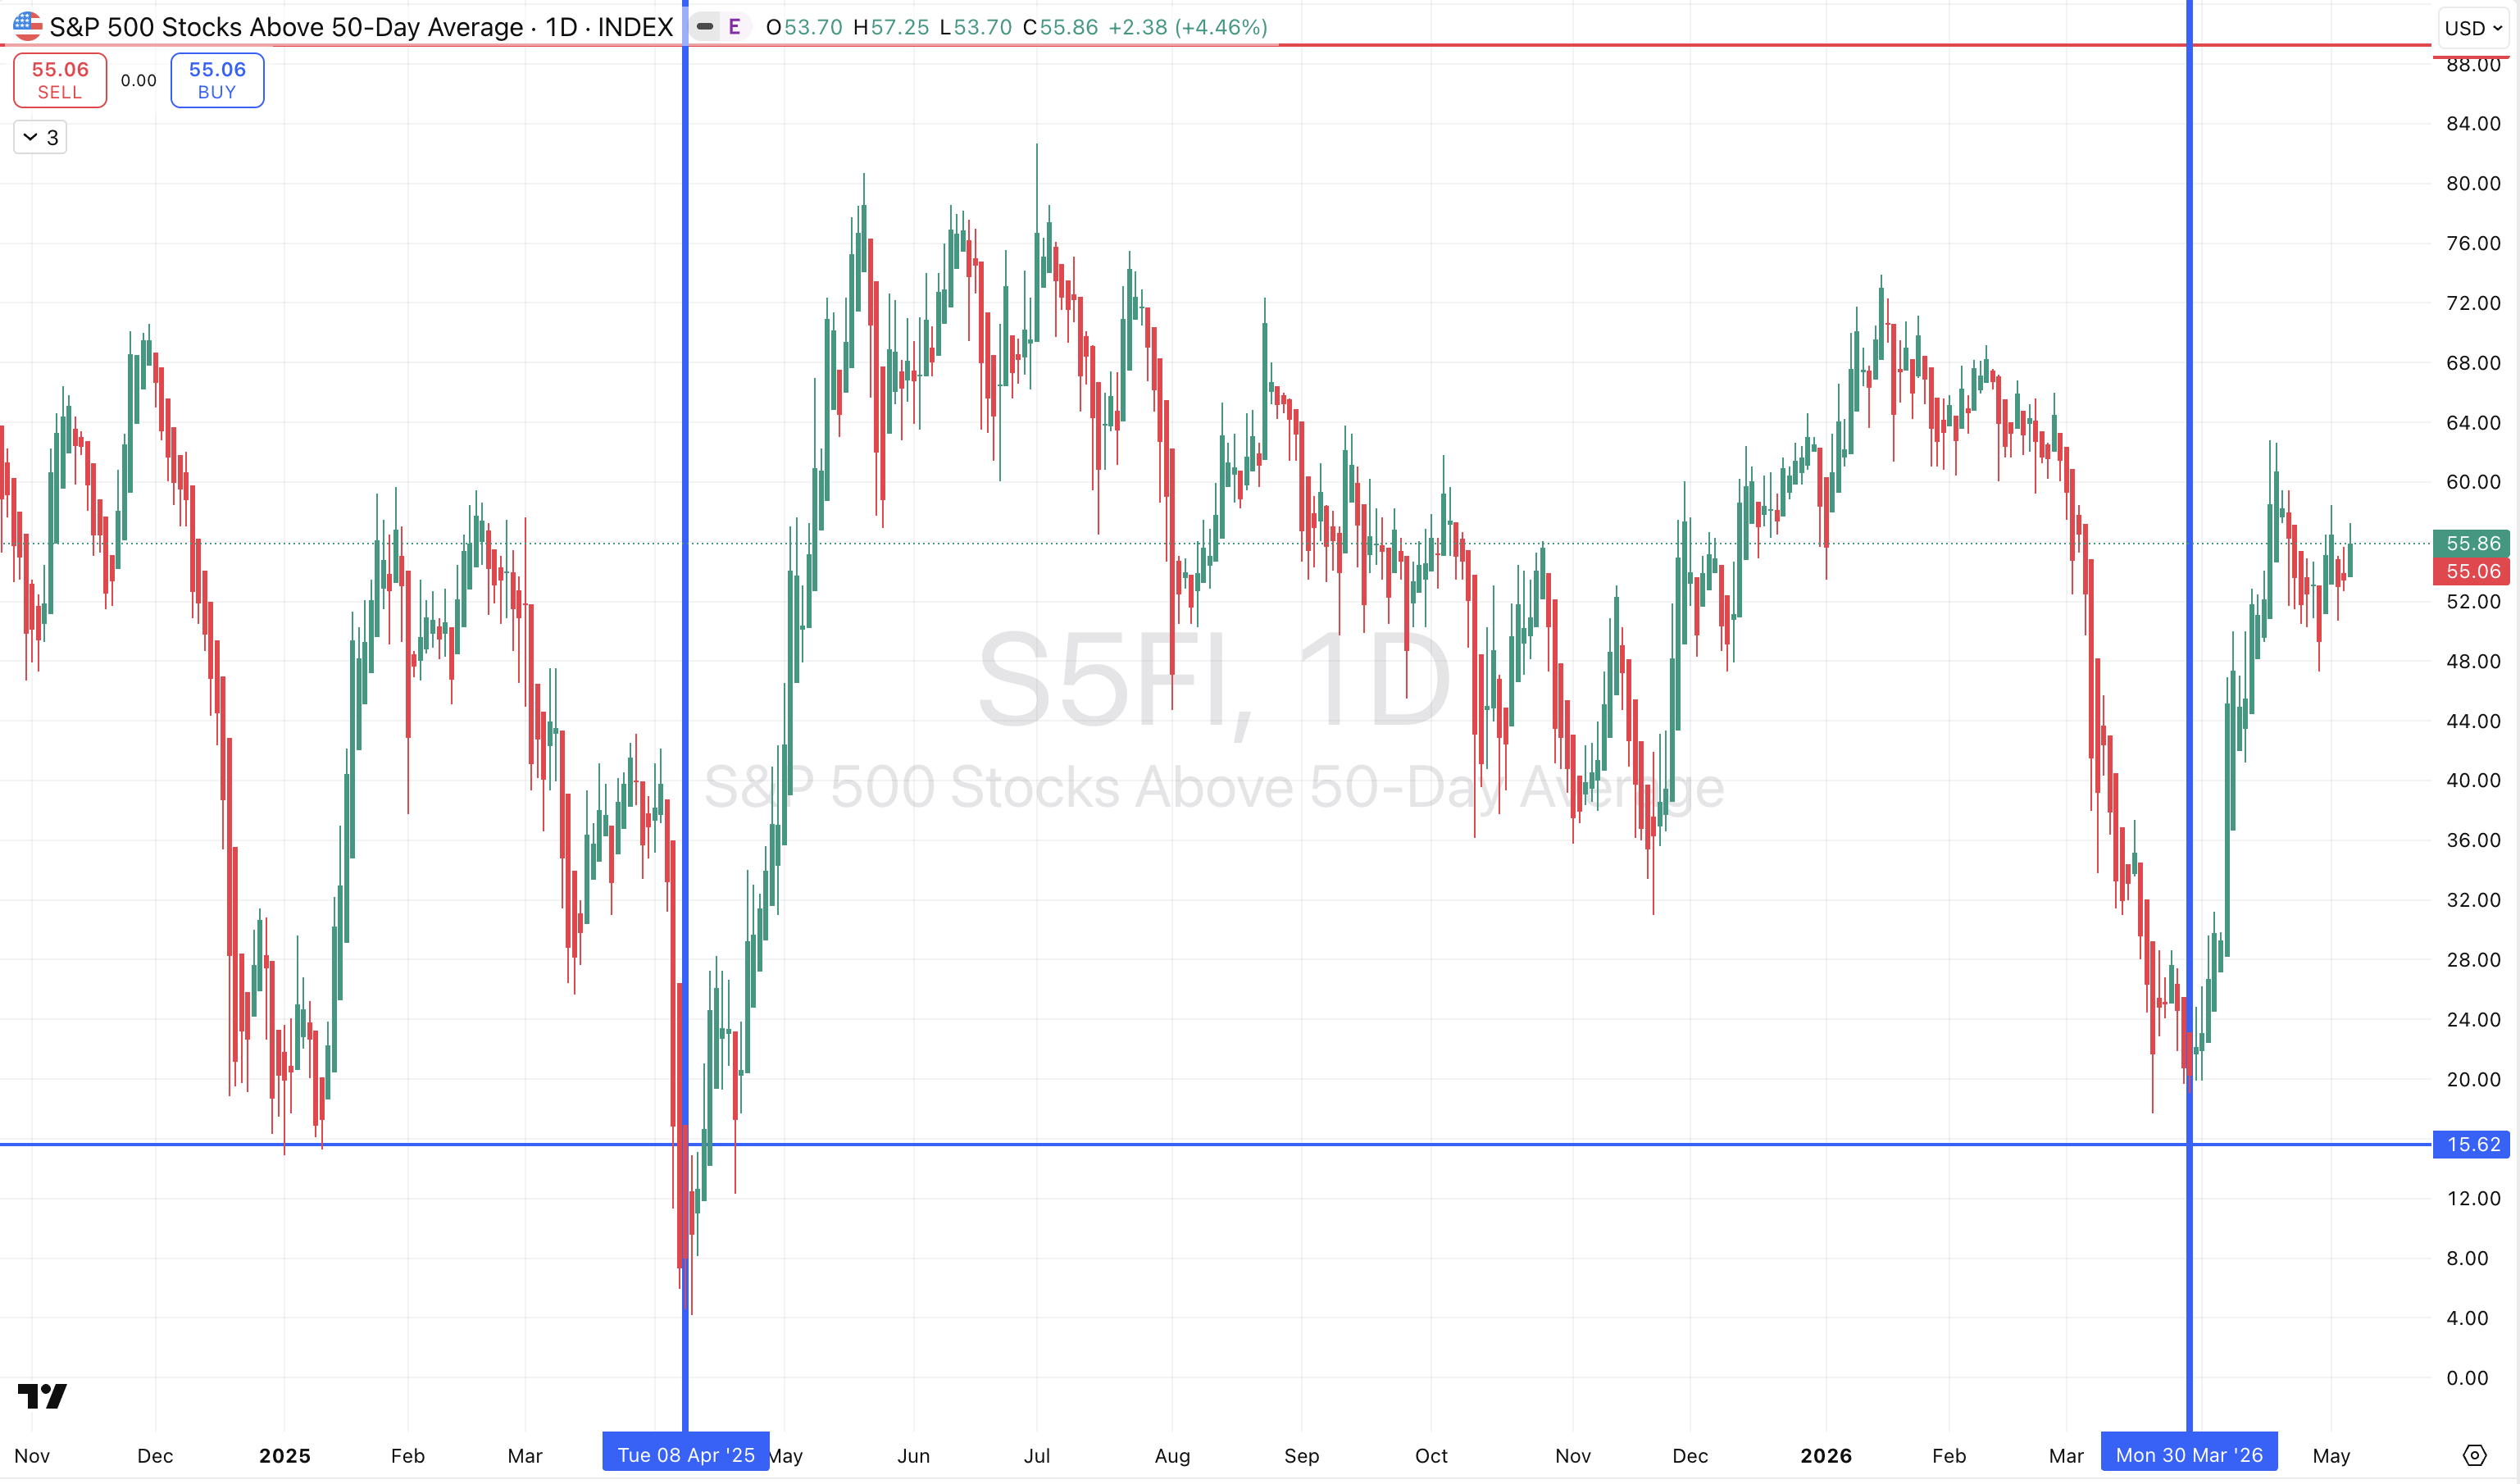
source:Trading View
Top 10 stocks account for all of the move in S&P 500 (89% for Nasdaq 100)
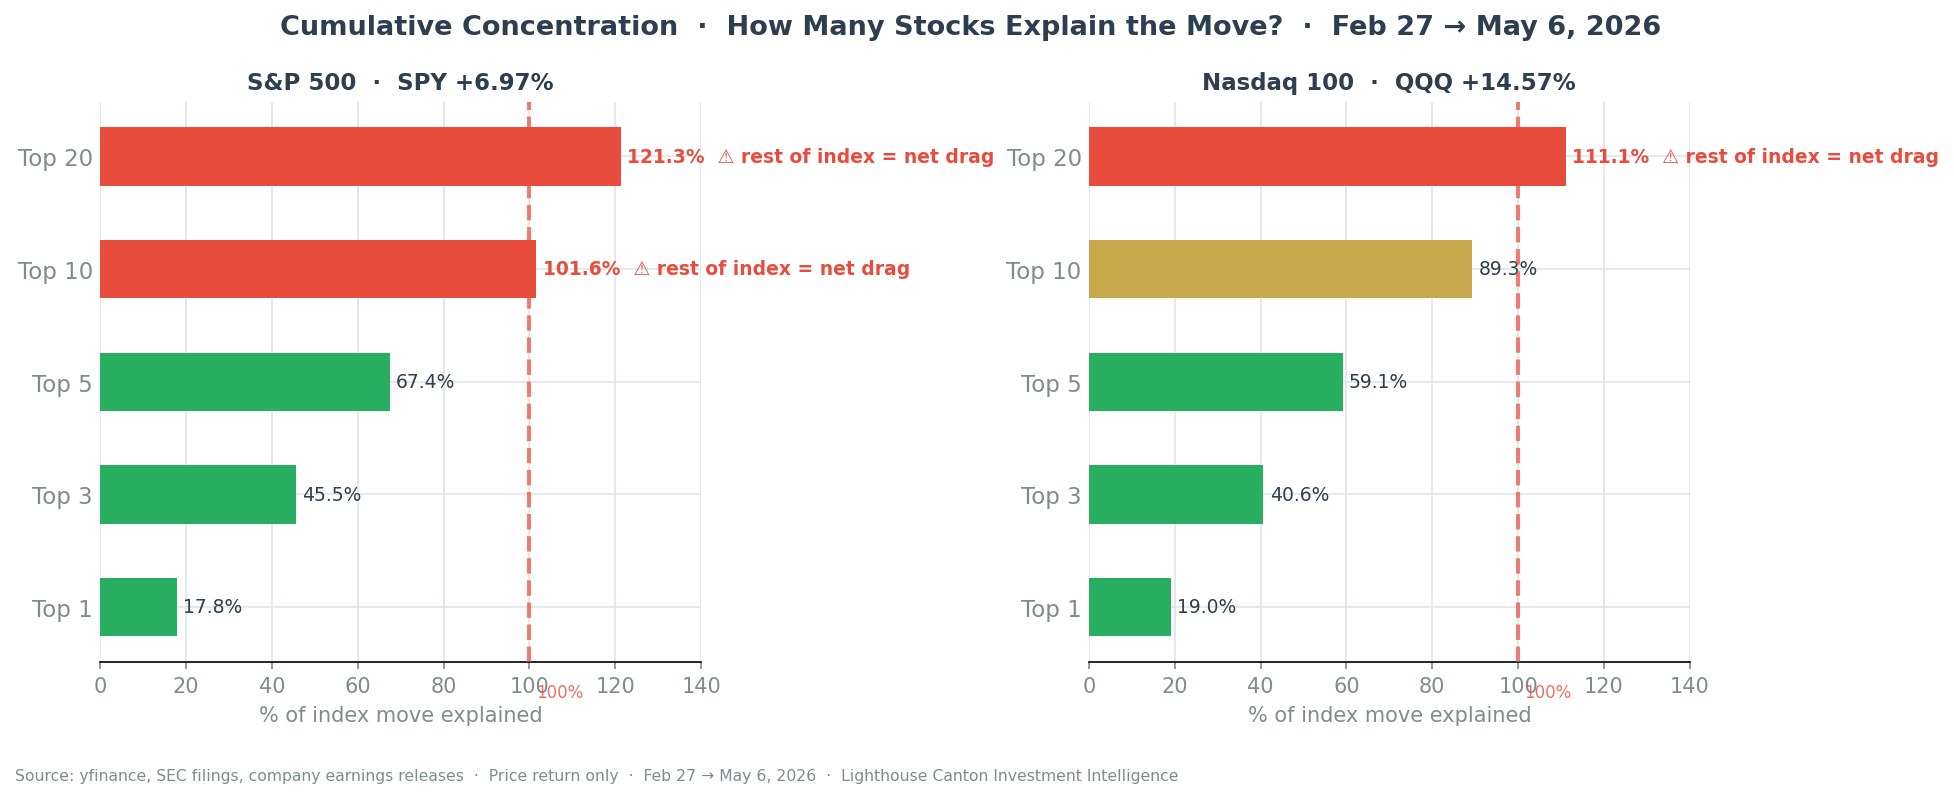
source: Lighthouse Canton
10 of 11 Sectors Lag the Index – Only Tech is Leading
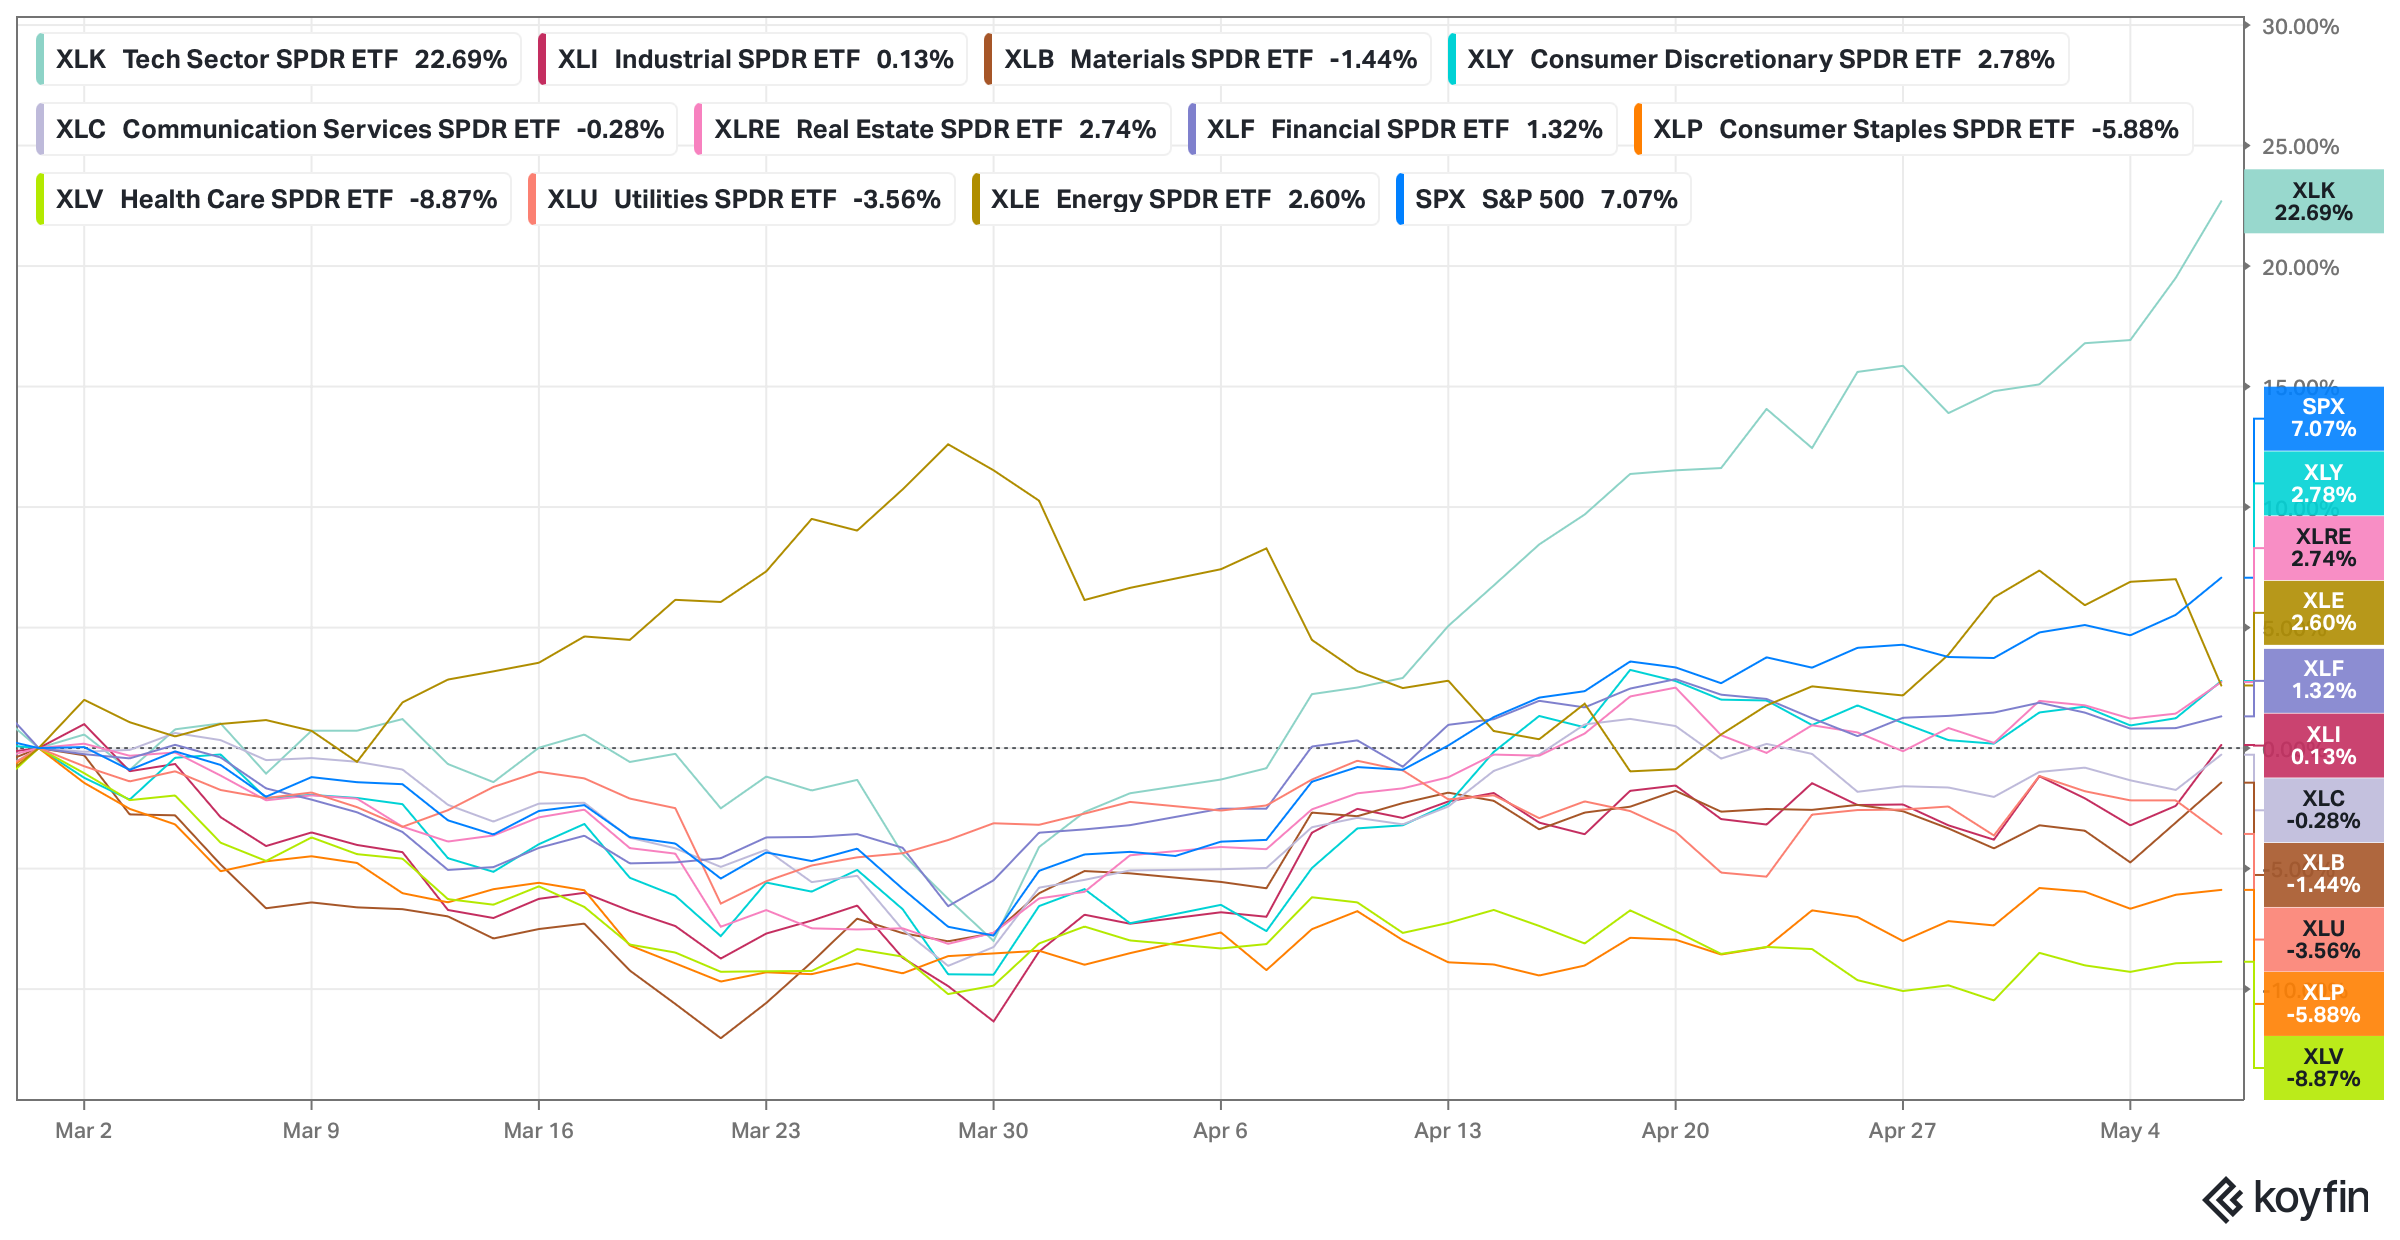
source: Koyfin
What The Head Says - Macro Has Worsened
The macro deterioration since February 28th is real, broad-based, and not yet reflected in equity prices beyond the non-tech sectors.
Consumer - Consumer Confidence at 49.8 is plumbing new depths and in context, well below even the COVID lows. Headline inflation is higher, and inflation is no longer on a glide path lower with the risk of spikes as supply shocks remain persistent. Even before war-induced supply shocks, higher commodity prices, tariff volatility (has impacted small businesses more) and worse labor mobility, all created inflation risks.
Labour - The “low-hire, low-fire” environment persists. Yet, the negative gap between job openings and unemployed people also persists. While headline unemployment is steady at 4.3%, rising lay-off announcements threaten the calm and associated risks to consumer spending.
Energy - Oil prices are exceptionally reactive to war news – yet, the damage to facilities is real and will take many months to restore (c6 months). While headline oil prices will ebb and flow with war and peace newsflow, the curve has decidedly shifted upwards and at c50% higher than 27thFeb, oil prices will most likely feed through to core measures of inflation. The damage is not just to oil prices – fertilizer shortages and broad based logistics disruptions are likely to feed through to all measures of inflation.
Inflation - The Consumer Price Index surged 0.9% in March, the sharpest monthly increase since 2022, pushing the annual rate to 3.3%. The Fed remains trapped – political pressure to cut vs. inflationary pressures to do the opposite. Futures price imply no meaningful cuts until well into 2027. What other central banks do will be telling – Australia has raised thrice and Singapore has also tightened monetary policy. And forecasts suggest the ECB will raise rates too.
Consumer Confidence – Plumbing New Lows
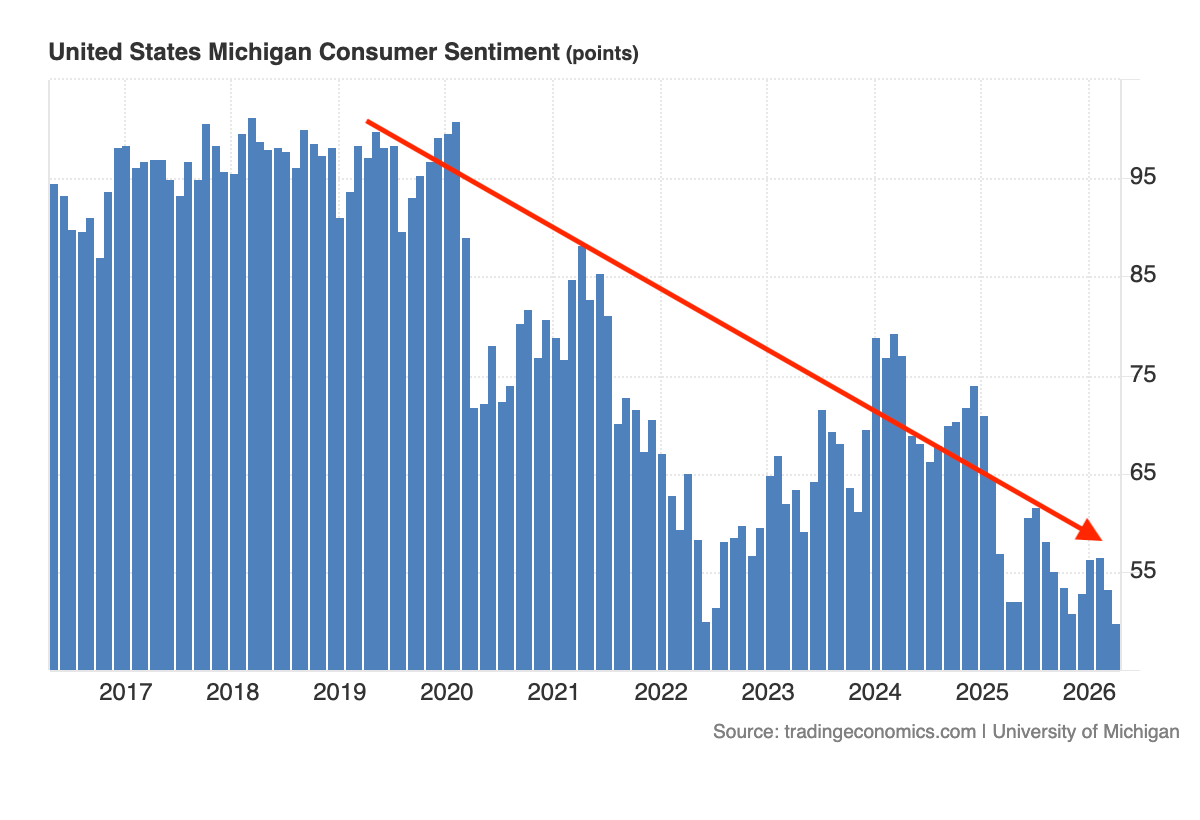
source: Trading Economics
Not Enough Jobs for The Unemployed
.png)
source:Trading Economics
Sustained Oil Prices Impact All Measures of Inflation – will Oil Sustain?
.png)
source:Trading Economics
The Earnings Verdict - Proof, Not Faith
The most consequential recent data point came on the evening of April 29th, when Microsoft, Alphabet, Amazon, and Meta reported simultaneously. The combined AI capex bill for 2026 across the four, now tracks $650–700 billion, the largest concentrated infrastructure cycle in technology history. The results were nuanced, and the market's reaction was instructive.
The proof: Google Cloud grew 63% year on year. Azure grew 40%. The core advertising businesses at Meta and Google are accelerating because of AI investment, not in spite of it. Microsoft's AI business surpassed an annualised revenue run rate of $37billion, up 123% year on year. These are genuine monetisation proof points, capex converting into revenue.
The concern: Meta raised its full-year capex guidance to $125–145 billion and fell 7% after hours. Amazon projected $200 billion in capex for 2026, while free cash flow for the trailing twelve months compressed to $1.2 billion, a 95% decline year on year. Investors are not yet willing to extend unlimited patience on the payback timeline.
AI monetisation is real and accelerating at Alphabet and Microsoft. At Meta and Amazon, the spend is scaling faster than the returns - and the market noticed.
HyperScaler- Capex vs. Revenue Growth
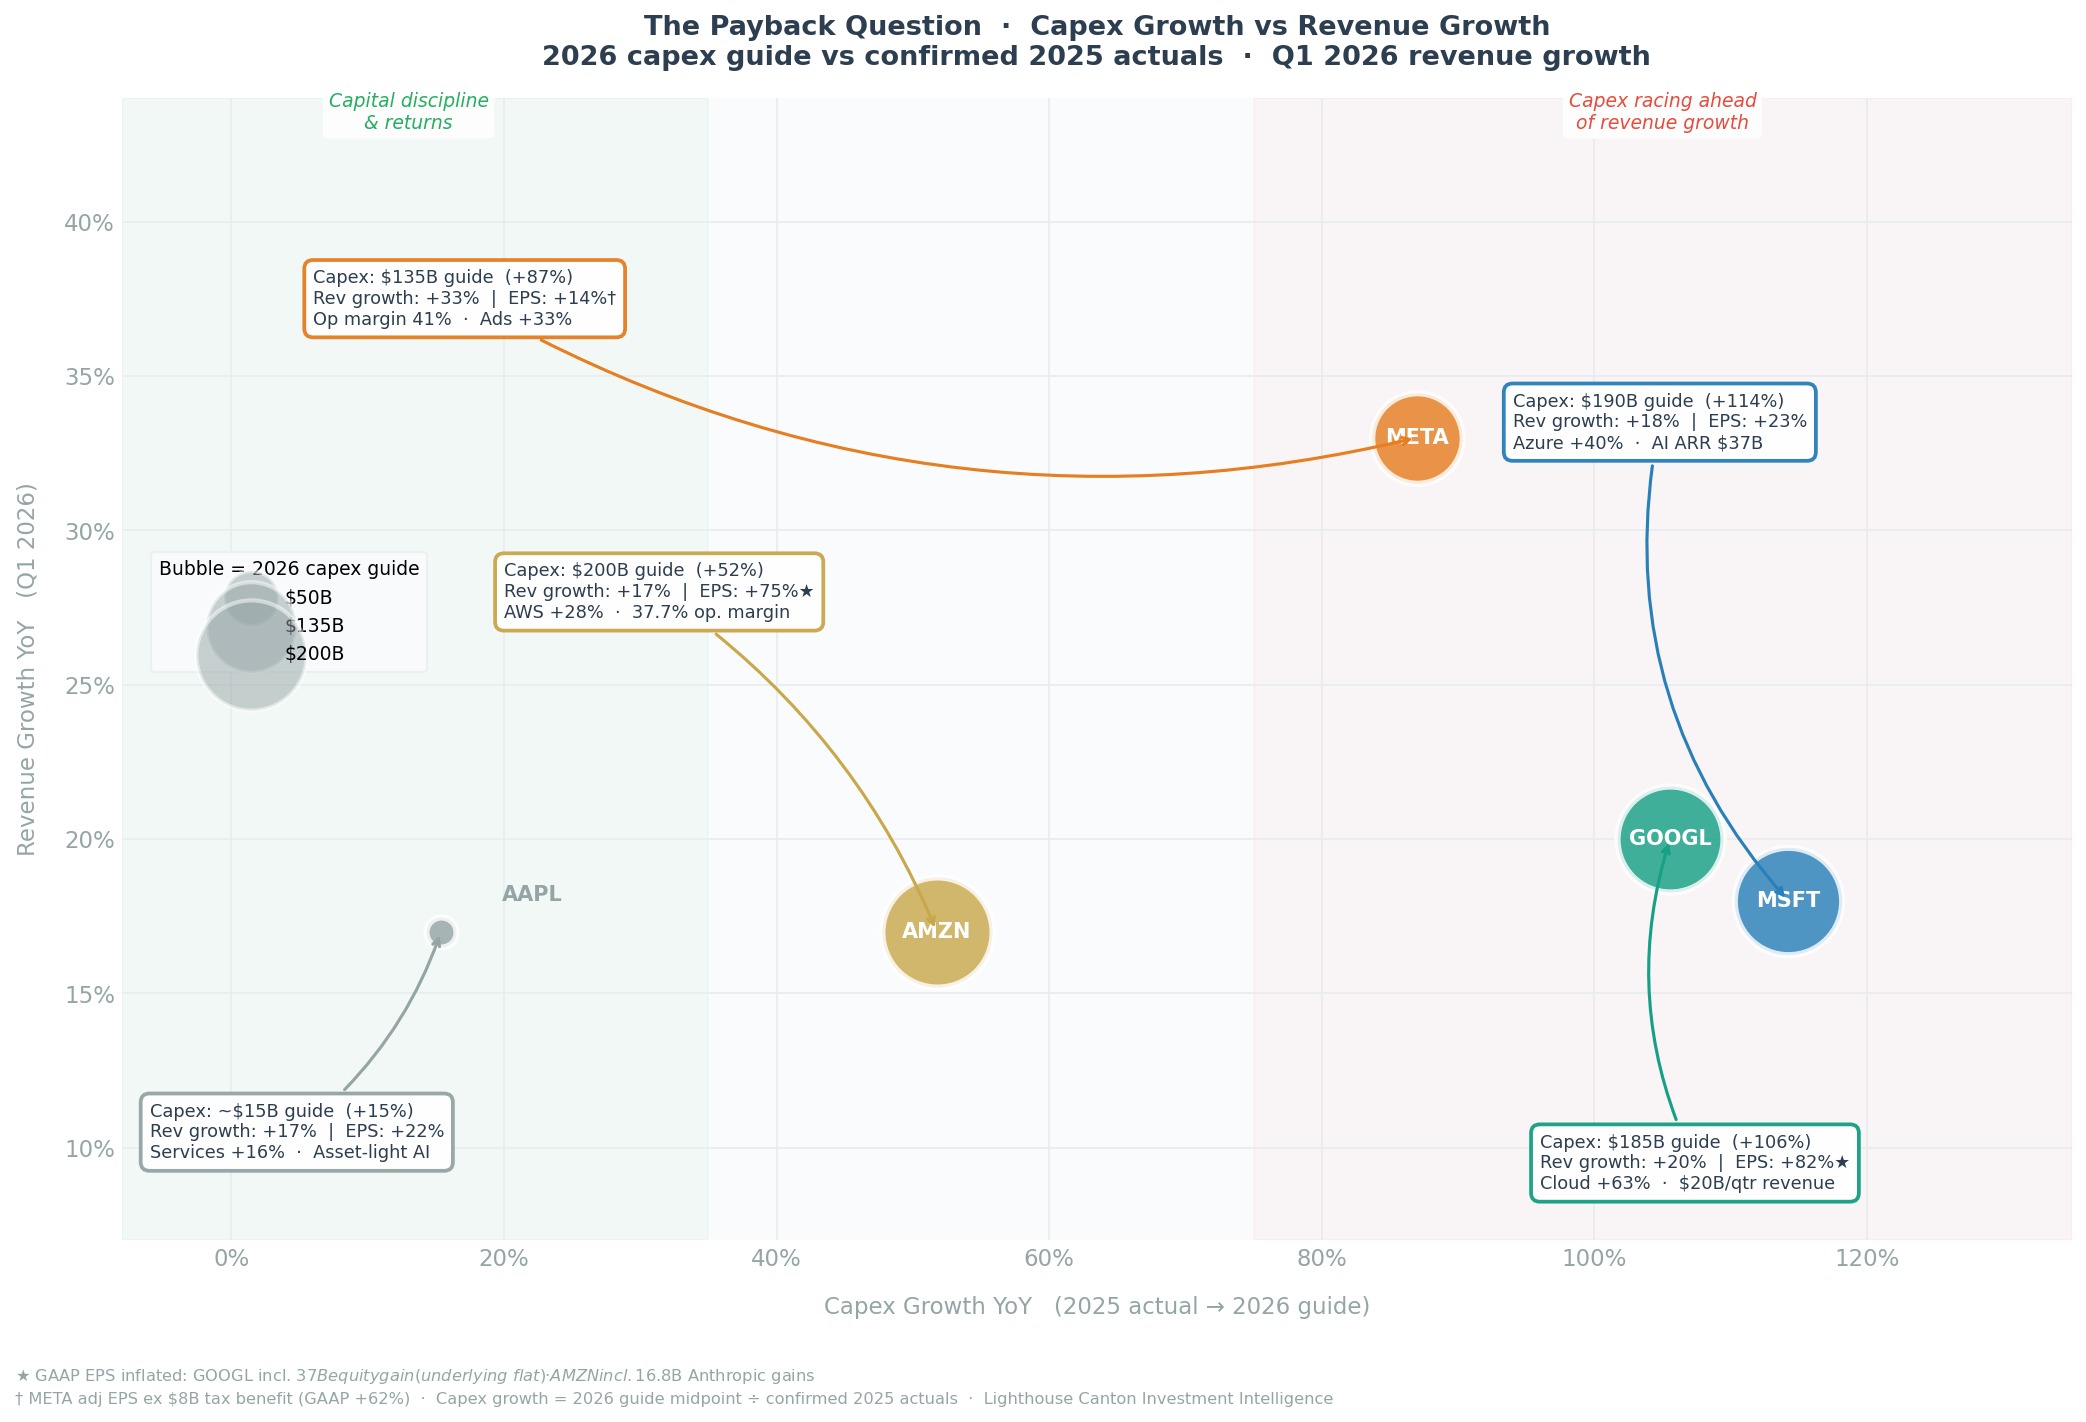
source:Lighthouse Canton
The Confirm / Deny Framework
Price action must be respected, but it must also be tested. The following summarizes what confirms or denies the bull case from here.
Confirmation Signals - Reasons to increase conviction and broaden exposure:
- Breadth improves: % of S&P 500 stocks above 50-day MA breaks decisively above 60%, laggards joining the rally
- Brent retreats sustainably: A move back toward the $70-80 handle would reduce the stagflation overhang and give the Fed room to manoeuvre
- Mag 4 guidance holds through Q2: If revenue growth continues to outpace capex growth, the AI monetisation story strengthens
- VIX sustains below 20: Complacency becomes confidence, investors deploying cash off the sidelines
- Labour market stabilises: Non-farm payrolls reaccelerating above 150K/month would signal the consumer can absorb the energy shock
Signals That Will Deny The Bullish Thesis - Reasons to stay disciplined and hedge:
- Breadth stalls below 55%: The rally remains a handful of names; any stumble in the leaders has no cushion
- Brent re-accelerates Or Remains elevated in the $90+ levels.: Diplomatic breakdown, Strait remains closed, stagflation scenario sharpens
- Q2 guidance disappoints: If Mag 4 companies guide conservatively inJuly, the AI premium compresses rapidly
- Fed turns hawkish: Sticky CPI/PCE forces a hawkish tone shift, rate cut expectations pushed back.
- Credit spreads widen: HY spreads moving above 450bps would signal the macro deterioration is reaching corporate balance sheets


.png)

.png)

.png)