
Investment Insights
Structured Products in a High-Dispersion Market: Why Basket Construction Matters | Derivatives Insights

Table of Contents
- Key Takeaways
- FCN Mechanics and the Worst-Of Structure
- The Correlation Trap: Why Cross-Sector Baskets Are Riskier Than They Appear
- Illustrative Example — Barrier Breach Probability vs. Correlation (ρ)
- Basket Comparison: Semiconductor Concentration vs. Cross-Sector Diversification
- Recommended Approaches to Hedging FCN Exposure
- Tier 1 — Broad Market Macro Overlay (Low Cost, High Basis Risk)
- Tier 2 — Sector ETF Proxy Hedges (Targeted, Moderate Basis Risk)
- Tier 3 — Single-Stock Puts (Highest Precision, Highest Cost)
- Volatility Overlays and VIX-Linked Instruments
- Basket Construction Principles Going Forward
Key Takeaways
FCNs on cross-sector or low-correlation baskets carry materially higher barrier breach probability — the elevated coupon is compensation for that risk, not free income.
Worst-of payoff structure: diversification is a liability. Lower correlation between underlyings raises the probability that at least one name independently breaches its barrier.
Single-stock skew compounds across basket members — each additional uncorrelated underlying adds negative convexity to the overall product.
In the current environment of elevated single-stock volatility and compressed cross-asset correlation, heightened selectivity around basket construction is warranted.
While single-stock puts offer the most direct hedge for underlying exposure in structures, they are also the most expensive. ETF-based sector proxy overlays offer a cost-efficient hedging framework for existing FCN exposure and are particularly effective for intra-sector or high-correlation baskets.
FCN Mechanics and the Worst-Of Structure
Fixed coupon notes (FCNs) are among the most widely placed structured products across private wealth and advisory mandates. In their most common form, an FCN pays the investor a periodic coupon in exchange for taking on downside equity exposure: if the worst-performing underlying in the basket closes at or below a pre-agreed knock-in at maturity or via continuous/periodic observation, the investor receives the depreciated stock rather than their principal.
The engine generating the premium — and therefore the coupon — is the short put written on the worst-performing stock in the basket. This is the mechanic that deserves the most attention because it means the product is not simply a basket of stocks. It is a basket of puts, and the pricing of that structure is acutely sensitive to inter-asset correlation.
The Correlation Trap: Why Cross-Sector Baskets Are Riskier Than They Appear
There is an understandable intuition among investors that a basket spread across multiple sectors — combining, say, a semiconductor name, a large-cap bank, and an energy major — is inherently more conservative than a single-sector basket of three technology stocks. This logic holds well for a long-only portfolio.
In worst-of structures, lower correlation between underlyings does not reduce risk — it increases the probability that at least one name breaches the barrier independently. This is the correlation trap. Structuring desks price the elevated knock-in probability — since they hedge the short worst-of put — and return the excess premium to investors as an attractive headline coupon. The coupon is not free income. It is compensation for taking on a tail risk that is larger than investors typically appreciate, and which may be obscured by the appearance of diversification.
Illustrative Example — Barrier Breach Probability vs. Correlation (ρ)
ρ = 1.0 (perfect correlation): The two stocks move in lockstep. Barrier breach probability = 30% — the same as holding one stock.
ρ = 0.5 (moderate correlation): Breach probability ≈ 45%. The two stocks can now diverge, increasing the chance that one triggers independently.
ρ = 0.0 (uncorrelated): Breach probability ≈ 51% — that is, 1 − (0.70)². The events are nearly independent; roughly a coin-flip chance that one name hits the barrier.
ρ = −0.3 (mildly negatively correlated): Breach probability rises above 55%. A portfolio that looks "balanced" on paper is generating its highest worst-of risk precisely because the stocks diverge.
Basket Comparison: Semiconductor Concentration vs. Cross-Sector Diversification
The following example (12 months, American barriers, no K/O) illustrates the risk differential between two baskets with identical individual stock volatilities but sharply different correlation profiles:
Basket 1 — NVDA, TSM, AVGO (Intra-Sector)
Stock | Spot (24/03/2026) | Strike (30% OTM) | Implied Vol | Breach Prob |
|---|---|---|---|---|
NVDA | 175.20 | 125 | 50% | 53% |
TSM | 343.25 | 240 | 52% | 55% |
AVGO | 318.29 | 220 | 54% | 57% |
Basket 1 Correlation Matrix
Underlying | NVDA | TSM | AVGO |
|---|---|---|---|
NVDA | 1 | 0.726 | 0.7 |
TSM | 0.726 | 1 | 0.716 |
AVGO | 0.7 | 0.716 | 1 |
Taking into account the above correlations, the probability of the worst-of breaching the barrier in the next 12 months is 72%.
Basket 2 — META, HWM, UNH (Cross-Sector)
Stock | Spot (24/03/2026) | Strike (30% OTM) | Implied Vol | Breach Prob |
|---|---|---|---|---|
META | 592.92 | 420 | 48% | 47% |
HWM | 239.51 | 170 | 48% | 47% |
UNH | 272.28 | 190 | 46% | 45% |
Basket 2 Correlation Matrix
Underlying | META | HWM | UNH |
|---|---|---|---|
META | 1 | 0.336 | 0.036 |
HWM | 0.336 | 1 | 0.046 |
UNH | 0.036 | 0.046 | 1 |
The probability of breach for the above basket is 79%. This is substantially higher than that for Basket 1, even though the stocks in this basket have lower implied volatilities.
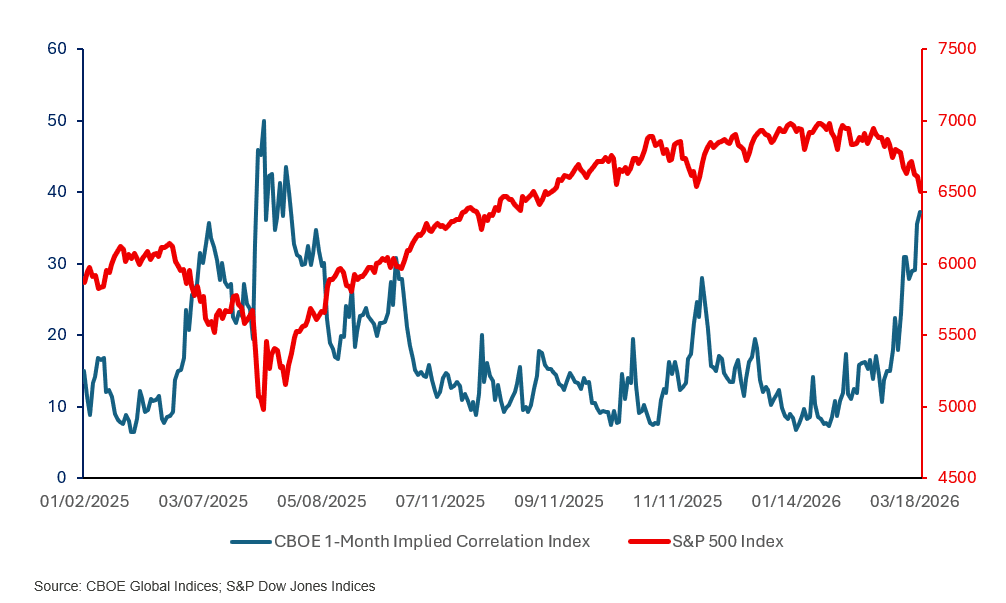
For structured product holders, there is a surface-level case that rising correlation is benign. In isolation, that logic is correct. The problem is the context in which correlation spikes invariably arrive. As the chart below illustrates, correlation does not rise gradually in orderly markets – it surges during selloffs, when index-level macro risk overrides stock-specific drivers. By the time correlation is rising and dispersion is falling, equities are typically already declining broadly, compressing the distance between the current spot and knock-in barriers across all basket members simultaneously.
This asymmetry is the central risk embedded in cross-sector FCN baskets: investors collect the coupon during low-correlation regimes when idiosyncratic risk is highest, and receive the "benefit" of rising correlations only when markets are falling hard enough to render it cold comfort.
Recommended Approaches to Hedging FCN Exposure
For clients who hold existing FCN positions or are actively participating in FCN issuance, we outline a tiered framework for hedging, ordered by cost, complexity, and precision.
It is important to note that any hedging strategy for an FCN must confront a fundamental asymmetry: the hedge is purchased at a cost (in premium, foregone upside, or drag), while the benefit accrues only if a barrier breach occurs. Over-hedging can eliminate the net carry benefit that motivated the FCN investment in the first place.
Tier 1 — Broad Market Macro Overlay (Low Cost, High Basis Risk)
The simplest and most liquid approach involves purchasing puts on a broad market index ETF proportional to the equity exposure implicit in the FCN book. This approach suits investors with significant FCN notional who seek broad market downside protection without managing individual names. The primary limitation is basis risk: a sector-specific correction may not be captured by an SPX-level hedge.
Instrument | Description | Effectiveness | Cost |
|---|---|---|---|
SPY / IVV puts | Broad US large-cap equity | Very High | Very Low |
QQQ puts | Nasdaq-100 / tech-heavy | High | Low |
IWM puts | US small/mid-cap exposure | Medium | Low |
EEM / ACWX puts | Emerging markets / non-US equity | Medium | Low |
Tier 2 — Sector ETF Proxy Hedges (Targeted, Moderate Basis Risk)
For investors who know the sectors of their underlying FCN names, sector ETFs and similar vehicles provide a more targeted hedge. The option markets on these ETFs are liquid, and the beta of individual large-cap names to their sector ETF is typically 0.7–1.2x, providing meaningful directional protection at lower basis risk than a broad index approach.
Sector | Broad ETF | Specialized Proxy |
|---|---|---|
Technology | XLK | IGV (Software), SMH (Semis) |
Financials | XLF | KBE (Regional Banks) |
Energy | XLE | XOP (Exploration & Production) |
Consumer Discretionary | XLY | XRT (Retail) |
Healthcare / Pharma | XLV | XBI (Biotech) |
Industrials | XLI | ITA (Aerospace & Defense) |
Materials | XLB | GDX/SIL (Mining & Metals) |
Tier 3 — Single-Stock Puts (Highest Precision, Highest Cost)
The most precise — and typically most expensive — hedging approach is to purchase vanilla puts directly on the FCN underlyings. This eliminates basis risk entirely and allows the investor to hedge each name at exactly the relevant barrier level, sized to the FCN's effective delta. This approach is most appropriate when the FCN notional is large relative to the total equity portfolio; when one underlying is trading near its barrier; or when the investor's primary concern is one specific name.
Out-of-the-money puts, positioned between current spot and the FCN barrier, tend to offer the best cost-adjusted protection, capturing most of the directional benefit while avoiding the very expensive near-barrier put premium.
Volatility Overlays and VIX-Linked Instruments
FCN investors are implicitly short volatility: they have sold an option (the worst-of put). A natural complementary hedge is to purchase volatility exposure through VIX-linked instruments, which appreciate when market volatility spikes — typically coinciding with the sharp drawdowns that risk triggering FCN barriers. VIX call spreads (e.g., long the 20-strike / short the 35-strike) are a cost-efficient way to express a "volatility spike" hedge without taking directional equity risk.
VIX instruments are proxies for S&P 500 implied volatility, not single-stock volatility. During idiosyncratic single-stock events, the VIX may not react commensurately, making this a broad-market volatility hedge rather than a name-specific tool. Roll cost and contango drag must be managed actively.
Basket Construction Principles Going Forward
Beyond hedging existing exposures, we recommend applying more rigorous selection criteria at the point of basket construction. The following principles, if applied consistently, should materially reduce the expected shortfall profile of new FCN issuance:
Prefer intra-sector or high-correlation baskets. A basket of three semiconductor stocks or three large-cap US banks will have higher pairwise correlation than a cross-sector mix. The coupon will be modestly lower, but the adjusted risk profile is substantially improved. Investors should look at correlation matrices, not just individual stock implied volatility levels, when evaluating a new FCN offering.
Avoid mixing structurally different volatility regimes. Placing a mega-cap tech name alongside a mid-cap energy or materials name creates a basket with highly asymmetric event risk. These names are driven by different macro factors, sectors, and catalysts — their correlation is regime-dependent rather than structurally stable.
Match tenor to the volatility environment. Longer-tenor FCNs carry compounding event risk and are structurally exposed to more macro regime changes. In periods of elevated volatility, shorter tenors (3–6 months) allow for more frequent reassessment and reduce the probability space in which any individual barrier can be breached.
Monitor the effective delta of each underlying continuously. As market conditions evolve, the delta of each underlying within the worst-of structure changes. A name that was initially far from its barrier may move into a higher-delta region as markets drift. Active monitoring enables timely hedging decisions before a defensive position becomes too expensive to establish.