


Some sovereigns are being paid to get better. Most are being paid to get worse. The market has the two backwards.
Sovereign credit this year is not behaving like one asset class. It is several regional stories pulling in opposite directions, and the risk ranking most committees still carry in their heads is out of date. The credit repair story belongs to emerging markets. The fiscal deterioration story sits in the developed world. And the spread market pays almost nothing for the former while asking investors to fund all the latter.
In practical terms, that means we would add risk in frontier Africa and higher-beta Latin America and prefer hard-currency EM high yield over EM investment grade and the former euro-area periphery over the core. We would stay away from emerging Asia and central and eastern Europe, where spreads no longer compensate for the fiscal risk building underneath them, and from long-duration developed-market debt, where the risk is now term premium rather than credit and is not priced as such.
Fitch has delivered seven emerging-market sovereign upgrades against two downgrades so far this year, and S&P has run thirty upgrades against eight downgrades over the twelve months to June. Over the same stretch the US is running a deficit of 5.8% of GDP with net interest climbing from 3.3% toward 4.6%, the UK printed a 30-year gilt yield of 5.822% in May, the highest since 1998, and Japan has taken policy rates to 1.00% against gross debt of 204% of GDP. None of this is a credit event in the technical sense. It shows up as term premium rather than spread, which is exactly why it goes unpriced by a committee looking only at credit spreads.
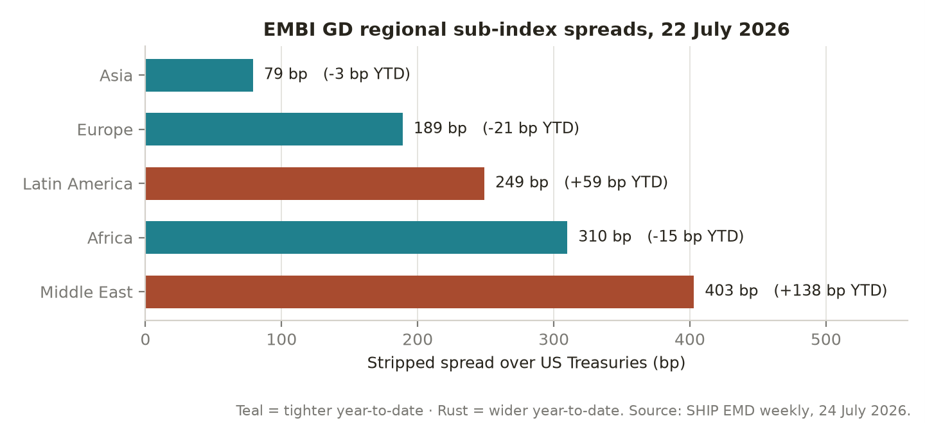
Regional dispersion in emerging markets is the widest of the cycle and running in different directions at once. The EMBI Global Diversified regional sub-indices span from 79bp in Asia to 403bp in the Middle East, a gap of 324bp. Latin America has widened 59bp this year and the Middle East 138bp, while Europe, Africa and Asia have all tightened. The Middle East number is misleading on its own: it reflects geopolitical risk premium and the weight of Bahrain rather than a broad Gulf deterioration, and GCC investment grade at roughly 78bp trades tighter than the broad EM investment-grade average.
Exhibit 1. The regional band is 324bp wide, and only one region is wider on the year
Source: SHIP EMD, Weekly Comments on Credit, 24 July 2026. Spreads are stripped spreads over US Treasuries for EMBI Global Diversified regional sub-indices.
Dispersion Inside Regions Matters More Than Dispersion Between Them
Regional labels have become close to useless as risk categories, because the spread between the best and worst credit inside almost every region is wider than the spread between the regional averages themselves. In the Gulf, Kuwait runs a 2026 fiscal surplus of 27.6% of GDP on debt of 22.3%, while Bahrain runs a deficit of 10.6% on debt of 152.4%, and five-year CDS spans from 29bp in Qatar to 242bp in Bahrain. Only Kuwait, the UAE and Qatar comfortably fund themselves at prevailing oil prices near $70. Latin America reverses the pattern: Chile sits at A and Peru at BBB-, against Brazil at BB and a 7.7% deficit, while Mexico was cut to BBB with a negative outlook in May, the exception to an otherwise global upgrade trend. Central and eastern Europe carries investment-grade ratings on fiscal trajectories that increasingly do not look investment grade — Romania and Poland both show widening deficits and, in Poland's case, debt jumping from 58.8% to 65.7% of GDP in a single year, while Czechia remains a clean AA- credit. Africa is the best-performing region over twelve months and still home to every remaining tail risk in the index, with Ghana and Ivory Coast recovering strongly even as Senegal and Mozambique deteriorate toward distress. Asia's issue is not deterioration but compression: China, India and Indonesia all show softening fiscal positions, yet the region prices at 79bp with nothing left to compensate for a rates shock or growth disappointment.
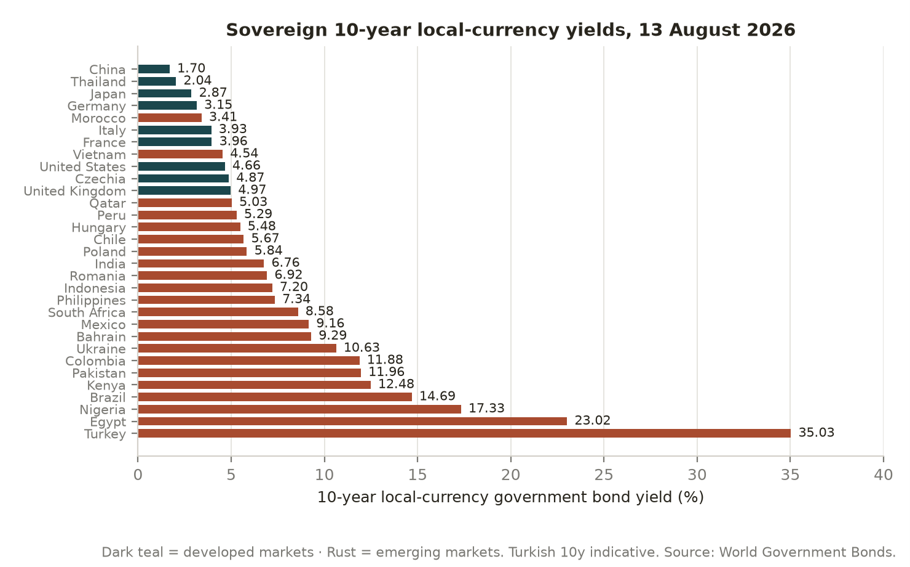
Exhibit 2. Nominal 10-year yields span 33 percentage points across the sovereign universe
Source: World Government Bonds 10-year yield board, read 13 August 2026. Local-currency yields; the Turkish 10-year is indicative, as the country page and the global board differed on the day.
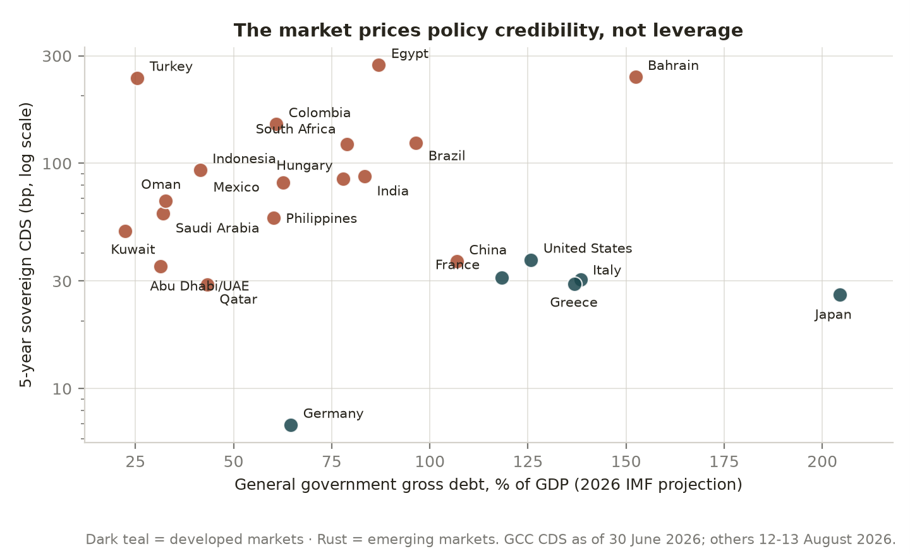
Exhibit 3. Leverage explains very little of where sovereigns actually trade
Source: General government gross debt as a share of GDP, 2026 projections, IMF DataMapper; five-year CDS from World Government Bonds country pages, 12-13 August 2026, GCC levels as of 30 June 2026 per Aranca.
Japan, at 204% of GDP, trades at 26bp, while Turkey, at 25% of GDP, trades at 240bp. What the market is actually pricing is reserve-currency status, institutional depth, the currency of the liability and the credibility of the policy framework, not the leverage ratio itself. Debt-to-GDP on its own is a weak screening variable; the interaction between external financing need, currency composition and programme anchoring is what really drives sovereign spreads.
Valuation: Where the Premium Survives and Where It Has Gone
The return profile this year has been a carry-and-credit story rather than a duration story. Year to date, EMBI GD high yield has returned 5.6%, GBI-EM 2.9%, the broad EMBI GD 2.8%, EMBI investment grade a flat minus 0.1%, and 20-year-plus Treasuries minus 3.6%. After two years of returns like that, the high-grade end of the spread market has almost no margin for error left.
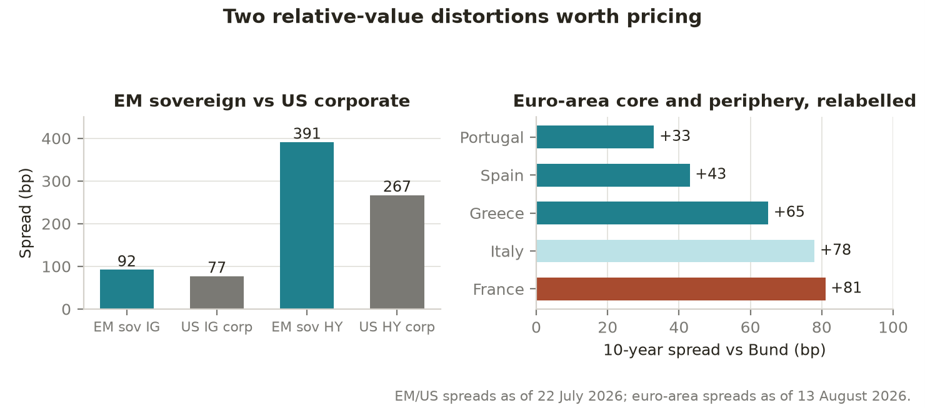
Exhibit 4. The EM investment-grade premium has disappeared, and euro-area core has been relabelled
Source: EM and US index spreads from SHIP EMD, 24 July 2026; euro-area 10-year spreads versus Bund from World Government Bonds, 13 August 2026.
An EM investment-grade sovereign, carrying transfer-and-convertibility risk, weaker institutions and thinner secondary liquidity, pays 92bp, while a US investment-grade corporate pays 77bp. Fifteen basis points of compensation for all of that additional risk is closer to a rounding error than a premium. GMO's framework puts the EMBIG-D excess spread of 79bp in the richest quintile of its own history, a starting point that has historically preceded roughly minus 2% annualised credit returns over the following two years. High yield is different: 391bp against 267bp for US high yield is genuine compensation of around 124bp, arriving at a point when the ratings cycle for that cohort is improving rather than deteriorating.
The same repricing has happened inside the euro area. France now trades 81bp over Bunds, wider than Italy at 78bp, Greece at 65bp and Portugal at 33bp. The old core-periphery hierarchy that defined the region from 2011 through 2024 has inverted, and it has inverted on fundamentals: Greece runs a fiscal surplus with debt falling toward 137% of GDP, Portugal is close to balanced, and France runs a near-5% deficit with debt climbing past 118%. ING expects a record EUR 930bn of euro-area net supply against a demand shortfall of roughly EUR 230bn in 2026, which argues this repricing has further to run rather than reverting.
Supply: A Structural Re-Basing, Not a Cyclical One
Sovereign supply has re-based to a level that no longer normalises, and markets have absorbed it without a spread event, which says something about the depth of demand and about how much of the adjustment has already gone through term premium instead.
Exhibit 5. Sovereign gross borrowing has re-based higher in both blocs
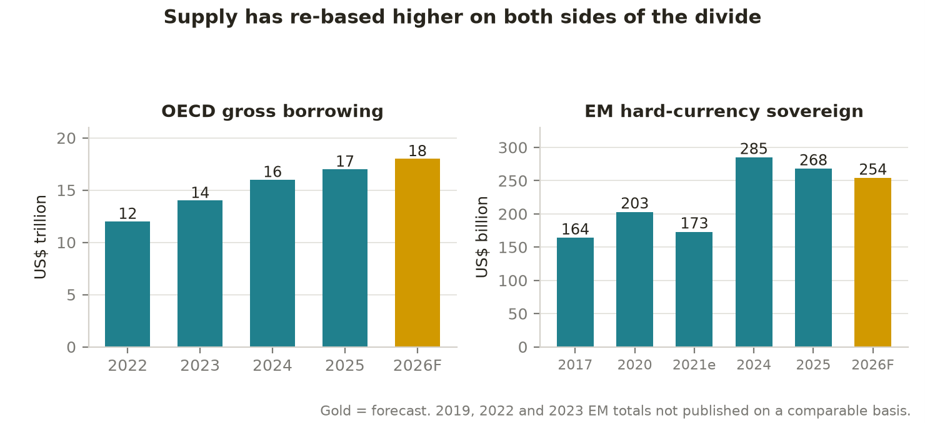
Source: OECD Sovereign Borrowing Outlook 2026; EM hard-currency sovereign gross issuance from J.P. Morgan estimates. 2019, 2022 and 2023 EM totals are not published on a comparable basis and are omitted rather than estimated.
OECD gross sovereign borrowing has climbed from $12tn in 2022 toward an expected $18tn in 2026, with outstanding stock rising from $54tn to $61tn. On the emerging-market side, hard-currency sovereign issuance hit a record $268bn in 2025 and is forecast at $253.7bn in 2026, absorbed at tightening rather than widening spreads with order books covered several times over. A supply-driven widening thesis has now been wrong for three consecutive years.
Exhibit 6. GCC volumes are at a record, but the sovereign is stepping back
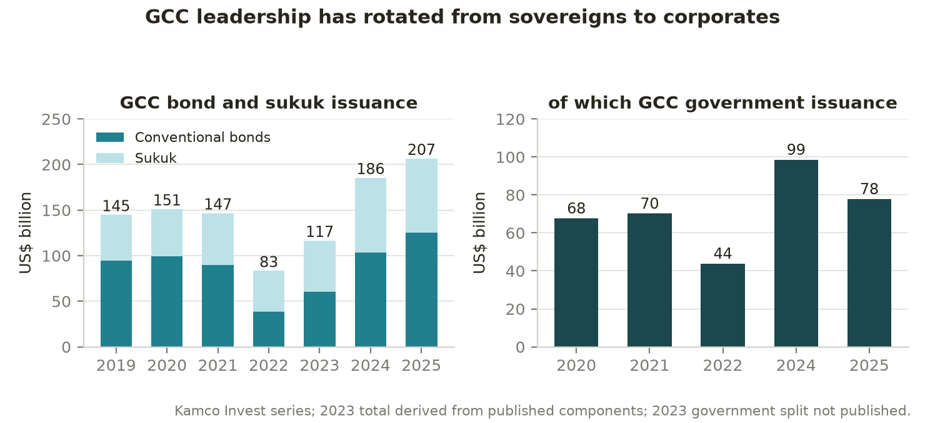
Source: Kamco Invest GCC fixed income series, via FAB Research and Enterprise; 2019-2021 series from Kamco Invest. Vendor series differ materially in coverage; Markaz reports roughly 25% lower totals for the same years.
GCC bond and sukuk issuance set a record near $207bn in 2025, but the composition inverted underneath that headline: government supply fell 21% to $77.9bn while corporate issuance rose almost 19% to a record $128.6bn. Saudi sovereign sukuk collapsed from $48.6bn to $10.5bn even as conventional Saudi sovereign bonds rose. The practical read for a Gulf-based allocator is that scarcity value in sovereign paper is rising while the credit-selection work shifts toward corporates and government-related issuers.
Exhibit 7. Africa has gone from complete market closure to the fastest start in thirteen years
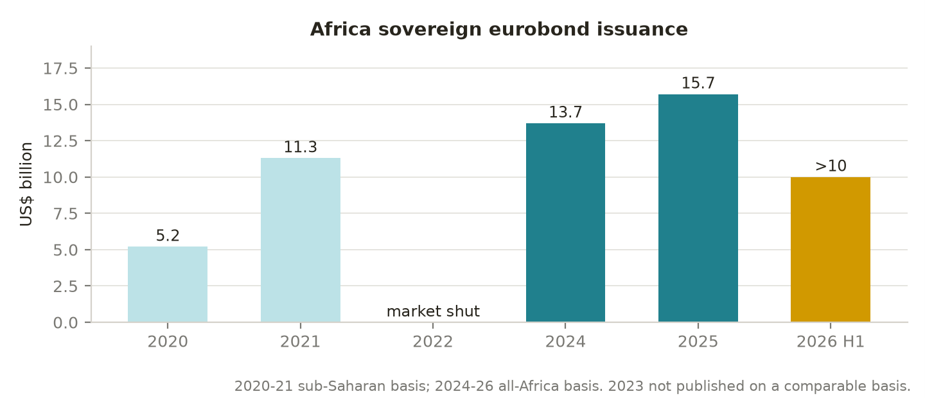
Source: Bloomberg, 20 February 2026; Attijari CIB; FinDev Lab.
Africa went from complete market closure in 2022 to more than $10bn of issuance in the first half of 2026, the fastest start to a year since 2013. The re-opening is real evidence that the default cycle has ended, but it deserves one discipline attached to it: of the forty African eurobonds priced above 9.5% since 2009, nine later defaulted. Access at any price is not the same as sustainable access.
Where We Would Take Sovereign Risk
Putting the fundamental and valuation strands together produces a ranking that cuts against fundamental momentum in some places and with it in others, because fundamentals and valuation have decoupled: the regions improving fastest are also the ones whose spreads have already compressed the furthest. We would overweight frontier Africa, excluding Senegal, Mozambique and Malawi, where the restructuring cycle is largely complete and spreads near 310bp still offer the best return profile in the index, and higher-beta Latin America on valuation grounds, even though its ratings cycle is the one currently turning down, because it is now the cheapest region in the universe. We would stay neutral, core-quality-only, on GCC investment grade, which is strong outside Bahrain and Oman but rich at around 78bp. We would underweight central and eastern Europe, where investment-grade ratings sit on fiscal trajectories that no longer support them, and emerging Asia, which is adequate rather than improving and prices at levels that leave no cushion. On the developed side we would stay underweight the euro-area core, where France now trades wide of Italy and the fiscal, supply and political paths all point the same direction, while turning neutral to overweight the former euro-area periphery, where the improvement is real and still underpriced. Across all of it, the specific trade we favour is a barbell: hard-currency EM high yield, funded out of EM investment grade and emerging Asia, where the premium has simply stopped existing.
What Would Change Our Mind
A rates shock rather than a credit shock is the biggest risk here. EMBI GD duration is around 6.1 years, and with the index yielding 7.13% against a 247bp spread, roughly two-thirds of that yield is Treasury risk, so a repeat of the March widening combined with a long-end selloff would hurt our high-yield overweight through duration, not credit. Oil sustained below $60 would push Saudi Arabia, Oman and Bahrain into larger financing programmes and test the scarcity thesis behind our GCC neutral stance. A cluster of African defaults, were Citi's expectation of up to three over two years to materialise close together, could close the frontier bid quickly. A disorderly euro-area repricing is possible if the France-Italy inversion, orderly so far, meets a record supply year against an estimated EUR 230bn demand shortfall. And the valuation signal could simply be early rather than wrong: rich markets can stay rich for a long time in a positive ratings cycle, so we treat the EM investment-grade underweight as giving up carry, not a timing call.


.png)

.png)
.jpg)