VIX, frequently referred to as the stock market's "fear gauge," measures the S&P 500's expected 30-day volatility derived from real-time options pricing. Below 20 is considered a “stable” (or complacent?) market - spikes are generally accompanied by price weakness as anxiety and panic rise. Another use of VIX, given its mean-reverting nature, is to sell elevated volatility (FCNs, Short Puts are some examples), albeit risks are higher too. BUT, in periods such as July 2026, VIX would have given no such guidance. Is there an alternative? Yes - VIXEQ.
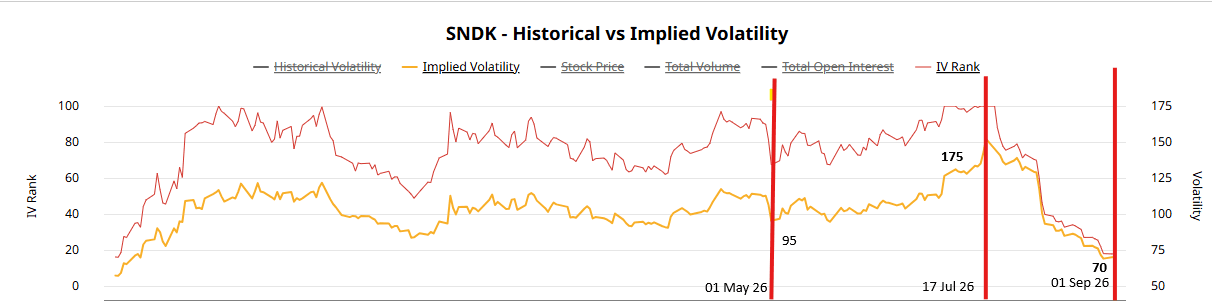
VIXEQ (Cboe S&P 500 Constituent Volatility Index) measures the market-cap-weighted, 30-day implied volatility of the individual underlying stocks inside the S&P 500, rather than the index itself. While at most times, VIXEQ will trade above VIX, when the ratio (VIXEQ/VIX) gets substantially out of historical ranges, it signals risks and opportunities. Fig 1 below shows the ratio of VIXEQ and VIX and the Z-score for the ratio. Extreme readings, such as those in late Jun, signalled elevated risks but also elevated premiums for volatility sellers. Fig 2 below shows the evolution of SNDK’s IV - from 95 in early May to 175 mid-July only to fall to 70 now. If you were wondering why you aren’t getting attractive coupons on FCNs or other short-vol strategies - its the IV compression that’s responsible!
How to Use the VIXEQ/VIX Ratio
- When to Sell Vol (Buy FCNs or Sell Puts) - Look for outlying readings above 2.6-2.7 - this where premiums are better than average.
- When to Buy Protection - Look for readings below 1.7-1.8 - this is where individual stock vols are low.
- Dispersion Baskets - When readings are depressed (below 1.5), dispersion is lowest and a higher probability that dispersion trades will be profitable. Equally, substantially elevated levels (of the VIXEQ/VIX) are the worst time to sell dispersion.
Fig 1 - VIXEQ/VIX & SOX
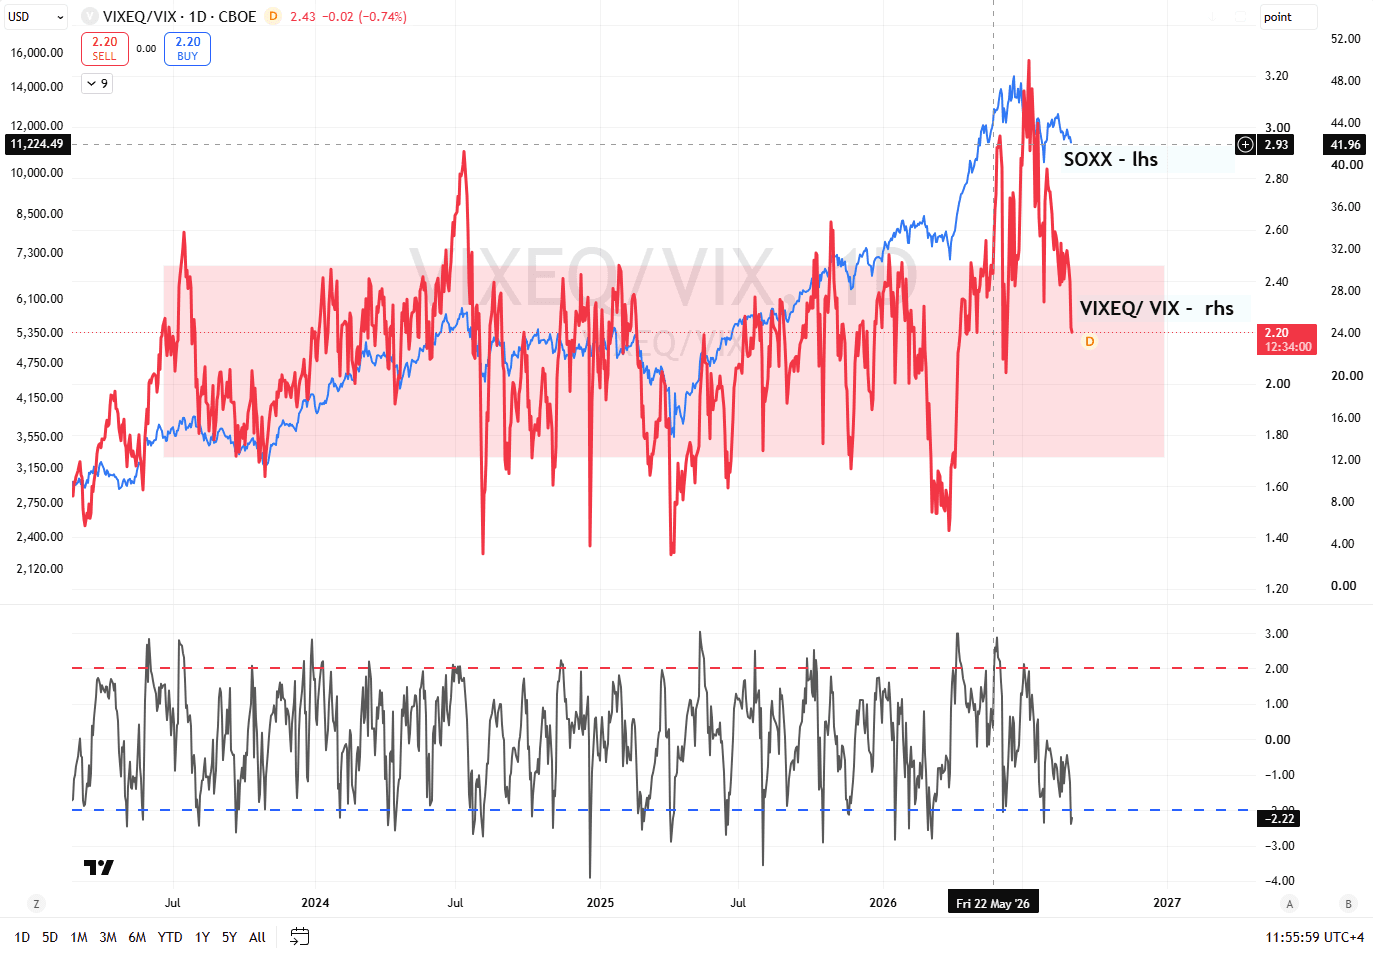
Fig 2 - SNDK Volatility Evolution




.png)