


Churchill’s “sum of all fears” - convergence of risks from multiple fronts.
In markets last week, the sum of all fears came true as markets digested higher producer price inflation, higher margins on precious metals, lacklustre earnings from some tech majors and the nominee for the next FED chair, waking volatility from its somnolence.
While post-event narratives attributing causality warrant skepticism, the forward trajectory remains clear- Volatility, Earnings, and Inflation will dominate 2026 market dynamics.
Equities face a critical inflection point where earnings quality and forward guidance separate winners from losers, exemplified by the stark divergence in Microsoft and Meta post-earnings price action. AI development velocity threatens established norms, howsoever nascent, with Moltbot and Kimi representing emerging competitive threats. Sector preferences favor Memory, Semis, and Chips within Technology, alongside overweight positions in Industrials and Healthcare.
Inflation and Interest Rates present persistent headwinds as Treasury yields anchor above 4.2%, reflecting structural inflationary pressures (tariffs), commodity prices, economic resilience, and fiscal expansion that collectively are a headwind to monetary easing.
Precious Metals maintain fundamental support through currency diversification dynamics (gold) and supply constraints (silver), though elevated margins will likely trigger speculative position unwinding. The path forward suggests heightened volatility rather than the secular appreciation trend witnessed over the past three years, with gold maintaining preference over silver.
%2520(1).png)
Precious Metals – Less Precious…
Gold & Silver Margin Requirements (January 31, 2026)

source: CME
COMEX implemented substantial margin increases across precious metals contracts, with silver experiencing the most aggressive tightening. Initial margin requirements jumped from 11% to 15%(36% increase) for standard accounts and 12.1% to 16.5% (36% increase) for heightened risk accounts. Gold margins increased from 6% to 8% (33% increase)and 6.6% to 8.8% (33% increase) respectively.
Coming in response to elevated volatility and risk of disorderly markets, such margin changes typically trigger cascading price moves exacerbating downside momentum.
Implication: Margin-induced volatility should subside as weak hands exit. However, elevated margin requirements will limit speculative participation going forward, potentially dampening upside momentum even as fundamental support remains intact.
Silver Futures - Margin-Induced Correction
MicroSilver Futures (COMEX) - Daily Chart

source: Trading View
Parabolic increases also correct exponentially. The dramatic decline on 30th Jan, has sailed through retracement levels and now testing critical 61.8% retracement in the $75 area. Ability to hold $75-80 support zone will define the path for bullish positions.
While many narratives attributed the collapse to the nomination of the new FED chair, higher CME margins are likely to have had a cascading impact, especially given the speculative rally in recent weeks.
Outlook: Until remnant speculative positioning is flushed out, volatility is likely to remain elevated– sharp upside reversals are likely post that. A break below the $75-80 support zone will warrant deeper corrections towards the $60 zone.
Gold Futures - Testing Critical Support
MicroGold Futures (COMEX) - Daily Chart

source: Trading View
Gold futures declined 11.4% to $4,745, breaking below the psychological $5,000 level and testing support at the 0.618 Fibonacci retracement ($4,643). The rejection from all-time highs near $5,627 is likely to have been triggered by higher margin requirement increases (6% to 8% standard; 6.6% to 8.8% heightened risk).
Outlook: Gold maintains superior risk/reward versus silver given relative stability and central bank accumulation trends. Critical support at $4,530-$4,640 needs to hold to support the bull case. Reclaim of $4,900-$5,000 would signal resumption of uptrend.Failure below $4,530 opens path to $4,375-$4,400.
US 10-Year Treasury Yield - Resistance Holding
US Government Bonds 10YR Yield - Daily Chart

source: Trading View
The 10-year Treasury yield trades at 4.249%, maintaining its position above the critical 4.20% resistance-turned-support level. After breaking above the descending trendline from mid-2024 peaks, yields have consolidated within a symmetrical triangle pattern, suggesting directional resolution imminent.
Technical indicators show mixed signals: Z-Score momentum remains elevated above 1.5 standard deviations, while MACD exhibits subtle bullish divergence. The 20-day EMA (4.21%) and 50-day EMA(4.17%) provide near-term support, with the 200-day EMA (4.20%) serving as pivotal longer-term anchor.
Outlook: Break above 4.30% would signal yield breakout targeting 4.40-4.50%, intensifying pressure on equity valuations and rate-sensitive sectors. Conversely, failure to hold 4.20% opens path toward 4.10-4.15%. Current trajectory favors higher yields given persistent inflation pressures and fiscal concerns.
Nifty 50 Index - Technical Breakdown
Nifty50 Index (NSE) - Daily Chart

source: Trading View
India’s benchmark Nifty 50 Index declined 2.3% to 24,825, breaking below the psychologically significant 25,000 level and all three major moving averages (20/50/200-day EMAs). The index now trades below the 200-day EMA (25,160), confirming a technical shift from uptrend to correction mode.
Momentum indicators confirm deterioration: Z-Score has plunged into negative territory (-2.37), indicating oversold conditions, while MACD prints deeply negative readings (-210) with bearish crossover. DMI shows directional weakness with the 14-day indicator declining sharply.
Critical support resides in the 24,400 area, representing May-Sep’25 consolidation lows. Failure to defend this zone exposes the index to 23,750 and then to 22,000.
Outlook: The weekend budget accentuated the declining trend and already weak sentiment, with a higher securities transaction tax (STT) on Futures and Options cited for causality, and overlooking any growth initiatives (including opening up for foreign investments). Our preference for India amongst emerging markets is largely a call on this being a quality diversifier, now trading on more defensible valuations.
MACRO DATA CALENDAR & ANALYSIS

source: Trading Economics
Labor Market: Gradual cooling evident but no collapse. Unemployment trajectory critical for Fed reaction function.
Manufacturing vs Services: Continued weakness in manufacturing offset by services resilience creates mixed picture.
Wage Inflation: Earnings growth remains elevated, complicating Fed’s inflation fight and limiting rate cut probability.
Friday NFP as Major Risk Event: Potential for significant volatility.
EARNINGS CALENDAR & ANALYSIS
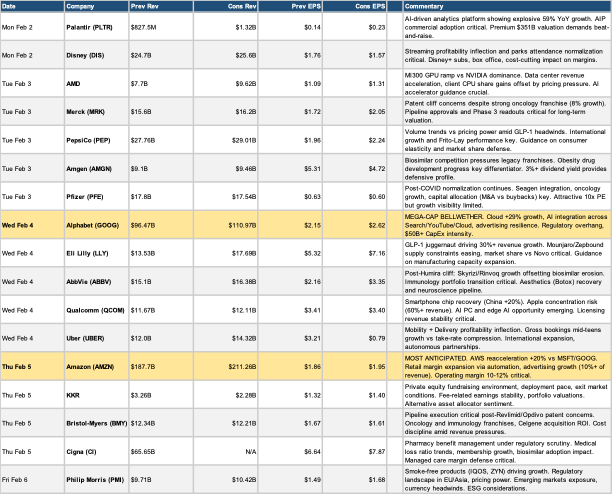
source: Trading Economics
Key Earnings Themes
Mega-Cap Tech Dependency: Alphabet and Amazon results will set tone for broader market given S&P 500 weighting. Cloud growth sustainability and AI monetization under scrutiny.
AI Infrastructure vsApplication Layer: AMD and Qualcomm represent chip infrastructure spending versus Palantir’s software monetization. Divergence between hardware capex and software ROI evident.
Healthcare Innovation vs Patent Cliffs: Merck, Pfizer, Bristol-Myers face legacy revenue erosion while Eli Lilly leads GLP-1 revolution. Pipeline execution and obesity drug development divergence evident.
Consumer Discretionary Signals: Amazon, Disney, Uber, PepsiCo reflect consumer health across value-seeking and experiential spending categories. Watch for margin pressure versus pricing power dynamics.
Guidance Over Headlines: In volatile markets, forward commentary matters more than backward-looking beats.Management tone on macro, pricing power, and demand visibility crucial.


.png)
%20(14).png)
.png)
