Tolstoy said every happy family is alike, and every unhappy one unhappy in its own way. Swap in credits for families and you have 2026: the index is contentedly average, and every name in trouble is in trouble for a reason of its own.
Key Takeaways
Bottom Line. Global credit is separating, not turning. Index pricing reads as benign, and in aggregate it broadly is — but the distribution of outcomes has widened more than at any point since 2020, and nearly all of the deterioration sits where marks are slow, disclosure is thin, or the borrower is at the bottom of the credit spectrum. We would own quality carry and duration, sell index beta in high yield, and underwrite the tail name by name or not at all. Three things would change our mind: a US unemployment break above 4.5%, a fourth straight quarter of double-digit private-credit redemption requests, and a fourth large collateral fraud.
• Headline high-yield spreads look calm, but the average hides the story: BB sits near 152bp while CCC trades near 1,049bp — 243bp wider over twelve months and close to a three-year high. The premium has migrated into the tail, concentrated in software, sponsor-owned healthcare and other asset-light names.
• Default counts are being flattered while losses deepen. Distressed exchanges account for 44% of this year's global defaults; 45% of defaulters have defaulted before, the highest re-default share since 2019; and first-lien recoveries have fallen from a 77% long-run average to 43% on 2025 vintages — a 3% default rate at that recovery now hurts more than a 4.3% rate did at 60%.
• Consumers have split rather than turned as a group. Prime US card delinquency is at a post-pandemic low of 0.84% while subprime auto ABS delinquency hit a July record of 6.13%. Bank-card losses have rolled over, but government-insured mortgages, subprime auto, student loans and non-bank lenders keep deteriorating.
• Private credit's cycle has already turned: Fitch's trailing default rate is a record 6.1%, more than double public high yield, with roughly 60% of that driven by interest deferral rather than missed payments.
• AI and data-centre financing is now the largest new concentration in investment grade. Hyperscaler issuance is running near $220bn this year against roughly $70bn for all of 2025 — the risk is not hyperscaler solvency, but that a single depreciation-schedule argument could re-rate a large slice of the index at once.
• Rates, not spreads, will move credit returns from here. US investment grade yields 5.53% on just an 81bp spread; ten-year gilts sit at 5.24% and JGBs at 3.02%, their highest since 1996. Japanese investors have sold roughly ¥3trn of foreign bonds this year, a flow that matters more to global spreads than any single credit event.
• US policy risk has turned hawkish: three FOMC members dissented in favour of a hike in July, and markets now price one for 16 September. Floating-rate borrowers running 1.6x interest coverage have little room to absorb that — an argument for fixed-rate BB/B risk over loans at the margin.
Positioning Implications
• Sell index beta in high yield and own BB/single-B carry; underwrite the CCC tail name by name or not at all.
• Use LME-inclusive default rates and a 45–50% first-lien recovery assumption in every stress test — agency headline rates understate expected loss this cycle.
• Prefer fixed-rate BB/B risk to floating-rate loans at the margin, given hawkish US policy risk and thin middle-market coverage.
• In private credit, favour new vintages at wider spreads and tighter terms over 2021–22 vintages, PIK-heavy books and semi-liquid retail wrappers; demand borrower-level mark comparisons across managers before committing.
• Own senior European bank and consumer ABS paper over junior tranches and treat euro investment grade as a yield allocation rather than a spread trade.
• Add EM corporate and hard-currency sovereign risk selectively rather than reaching down the US quality curve; avoid holding software direct lending and data-centre ABS in the same book without an explicit view on AI capital-cycle correlation.
• On the consumer side, avoid non-bank subprime originators globally, US government-insured mortgage risk and Indian fintech unsecured paper — UK unsecured lenders look mispriced for a 2027 impairment cycle.
1 Pricing the Risk
What the market is charging
Spread compensation for high-quality credit is close to the tightest of the cycle, but the buyer base behind it is yield-driven rather than spread-driven: insurers and fixed-maturity funds are buying 5.5% all-in yields, not 81bp of spread. If long yields rally meaningfully, that demand could thin out just as record supply needs absorbing — spreads could widen alongside a rates rally rather than offset it. The dispersion inside high yield is doing something it has not done since 2015: BB and single-B sit near the bottom of their recent ranges while CCC sits near the top, a pattern usually associated with a market that has correctly located where losses will land, rather than one that is complacent. This year's mistake has been holding the tail for carry.
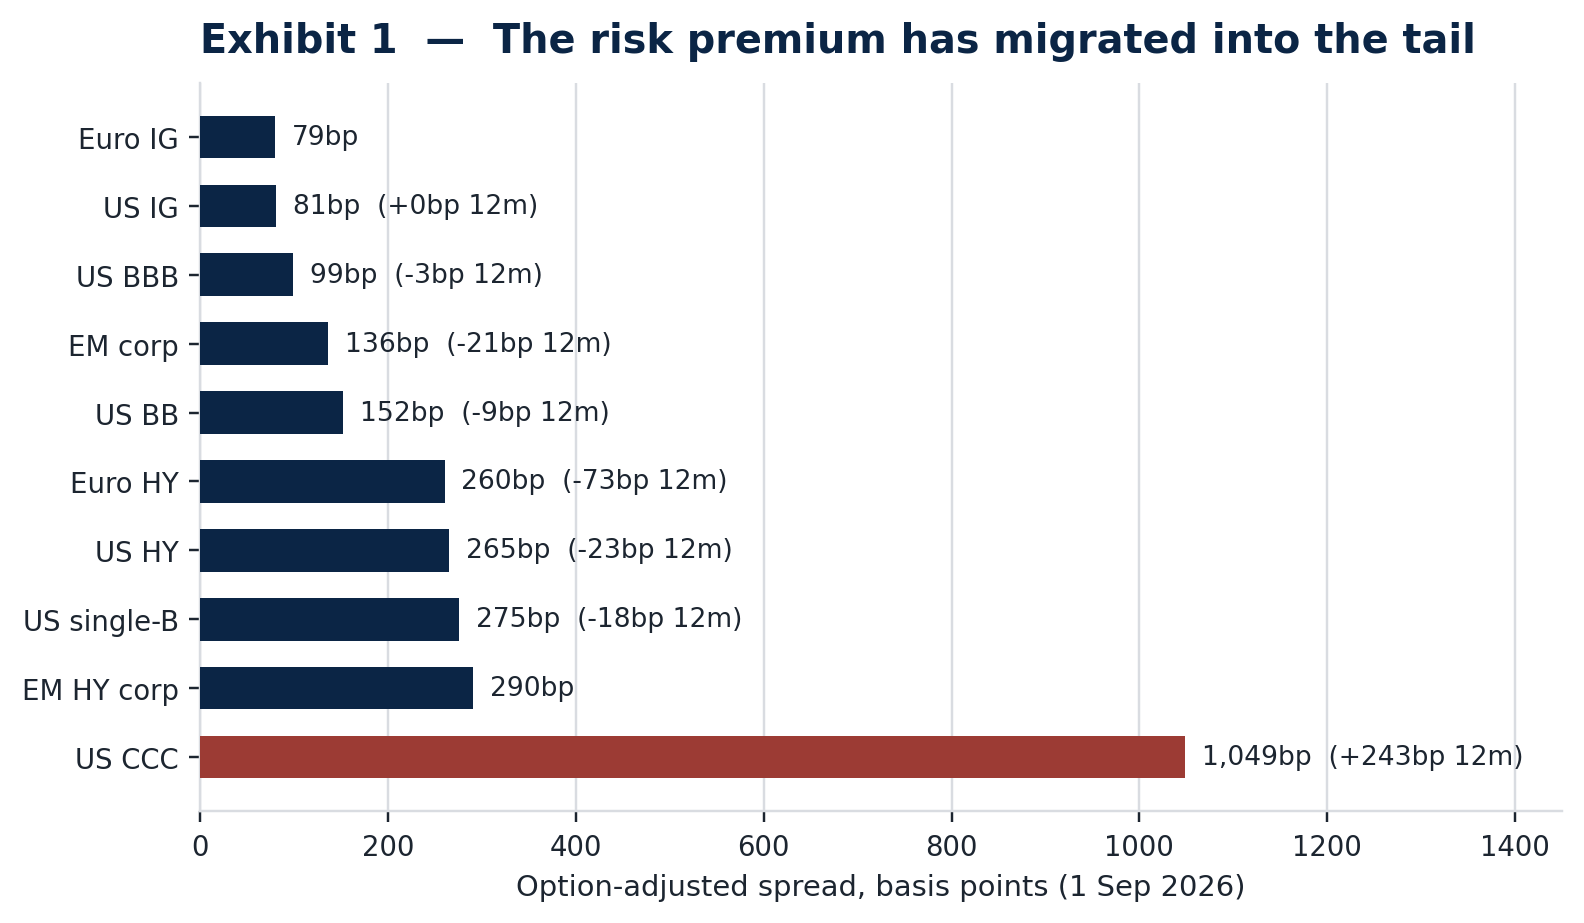
Exhibit 1. Option-adjusted spreads, 1 September 2026; twelve-month change shown where comparable history exists.
Macro and policy backdrop
Disinflation has stalled rather than reversed. US headline CPI is running at 3.4% (core 2.5%) — not a backdrop that supports rate cuts — and the euro area reaccelerated to 3.3% in August from 2.9% in July, with Spain at 4.3%. That keeps the Fed on hold with a hawkish tilt. We would be careful extending the same read to Europe: underlying growth in the euro area and UK is too fragile to absorb further tightening, and a follow-through hike from the ECB or the Bank of England now would look premature, doing more damage to credit than the inflation prints justify. We treat further European hikes as a policy-mistake risk rather than a base case and would expect both to hold. China is the exception on the other side: producer prices turned positive at 3.5% year-on-year, easing the real debt-service burden on industrial borrowers, though consumer prices at 0.5% show households have yet to recover.
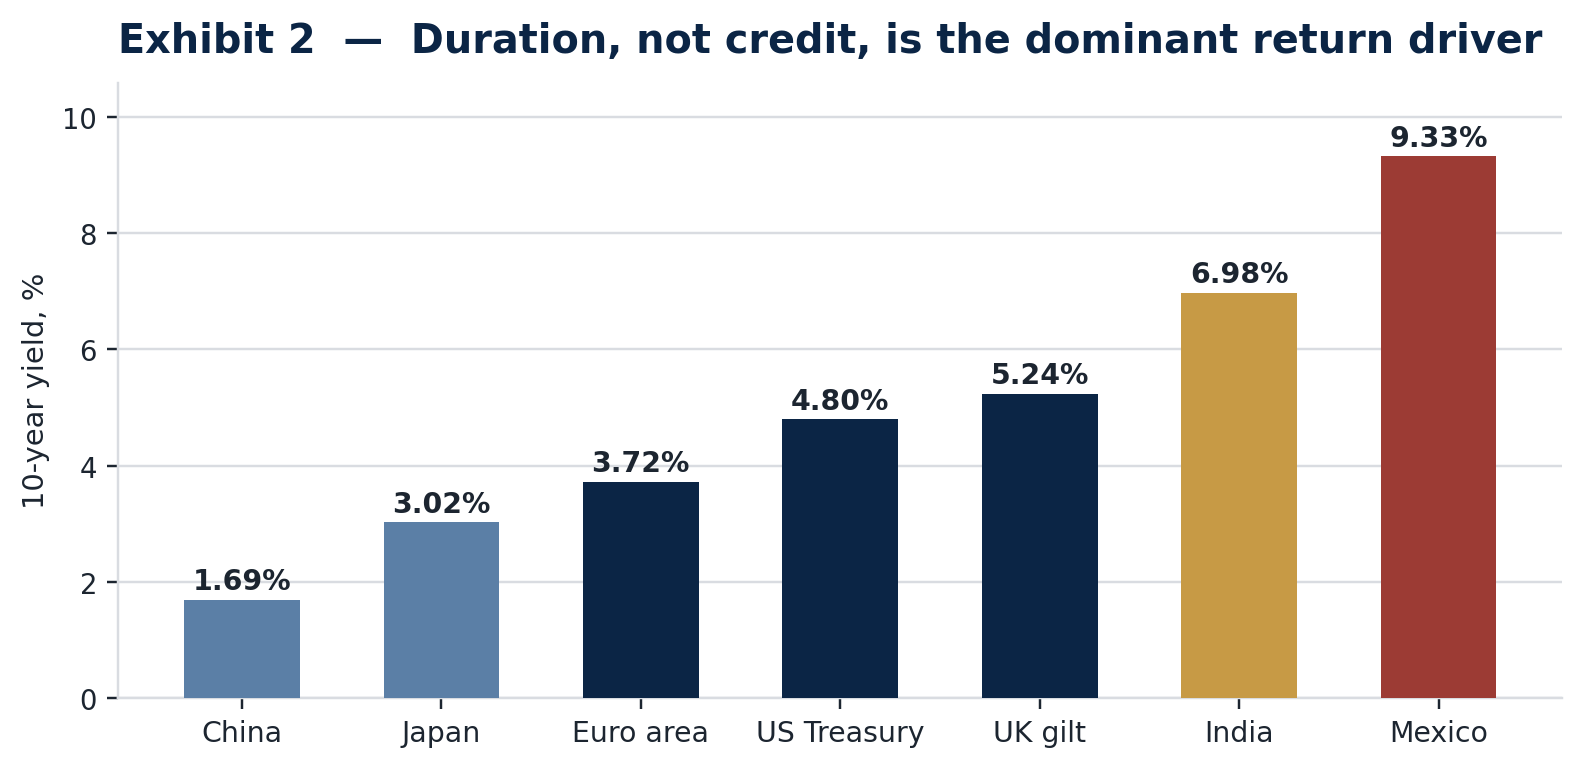
Exhibit 2. Ten-year government bond yields as at 2 September 2026.
2 Consumer Credit
The global picture
Aggregate leverage is not the problem — household debt-to-GDP has drifted lower across the US, UK, euro area, Korea and China over the past year, and only Australia (114%) and Canada (100%) look stretched by historical standards. What has changed is who holds the marginal loan: bank underwriting has tightened, particularly at the subprime end, while origination has migrated to fintechs, specialty lenders and asset-backed vehicles that report quarterly at best. US federal supervisory exams have fallen to roughly 70 this year from around 600 a year in 2020–24, so reported bank delinquency likely understates the true household loss rate. Employment, not leverage, remains the swing factor, and it is fraying at the edges: Stanford's Digital Economy Lab finds employment for 22- to 25-year-olds in AI-exposed occupations down 11% since late 2022 while the least-exposed cohorts are up 10% — a stress concentrated in the thinnest credit files.
United States
Total household debt reached $18.771trn in the second quarter (+$383bn year-on-year), with card balances at $1.263trn and auto at $1.713trn; home equity lines have risen for seventeen straight quarters to $459bn as owners tap trapped equity rather than refinance 3% mortgages. Card limits are at a record $5.56trn, a sizeable drawdown cushion into any downturn. The stock is improving — bank card delinquency down to 2.85%, charge-offs to 3.82%, Synchrony's net charge-offs down to 4.7% from a 5.8% February peak — but the flow is not: the share of balances rolling into 90-day delinquency rose for mortgages from 1.29% to 1.52% year-on-year, autos from 2.93% to 3.00%, cards from 6.93% to 6.97%. FHA delinquency is 11.79% (+122bp y/y), subprime auto ABS delinquency hit a July record of 6.13% against 0.49% for prime, and roughly 3.6mn federal student-loan borrowers have now defaulted since the repayment pause ended, with defaulters' scores falling an average of 91 points. The saving rate is 3.0%, July payrolls rose just 23,000, and a quarter of the unemployed have been out of work six months or more; Moody's stable-delinquency base case holds only inside a 4.0–4.5% unemployment band — a sustained break above 4.5% would turn a bifurcated cycle into a broad one within roughly two quarters.
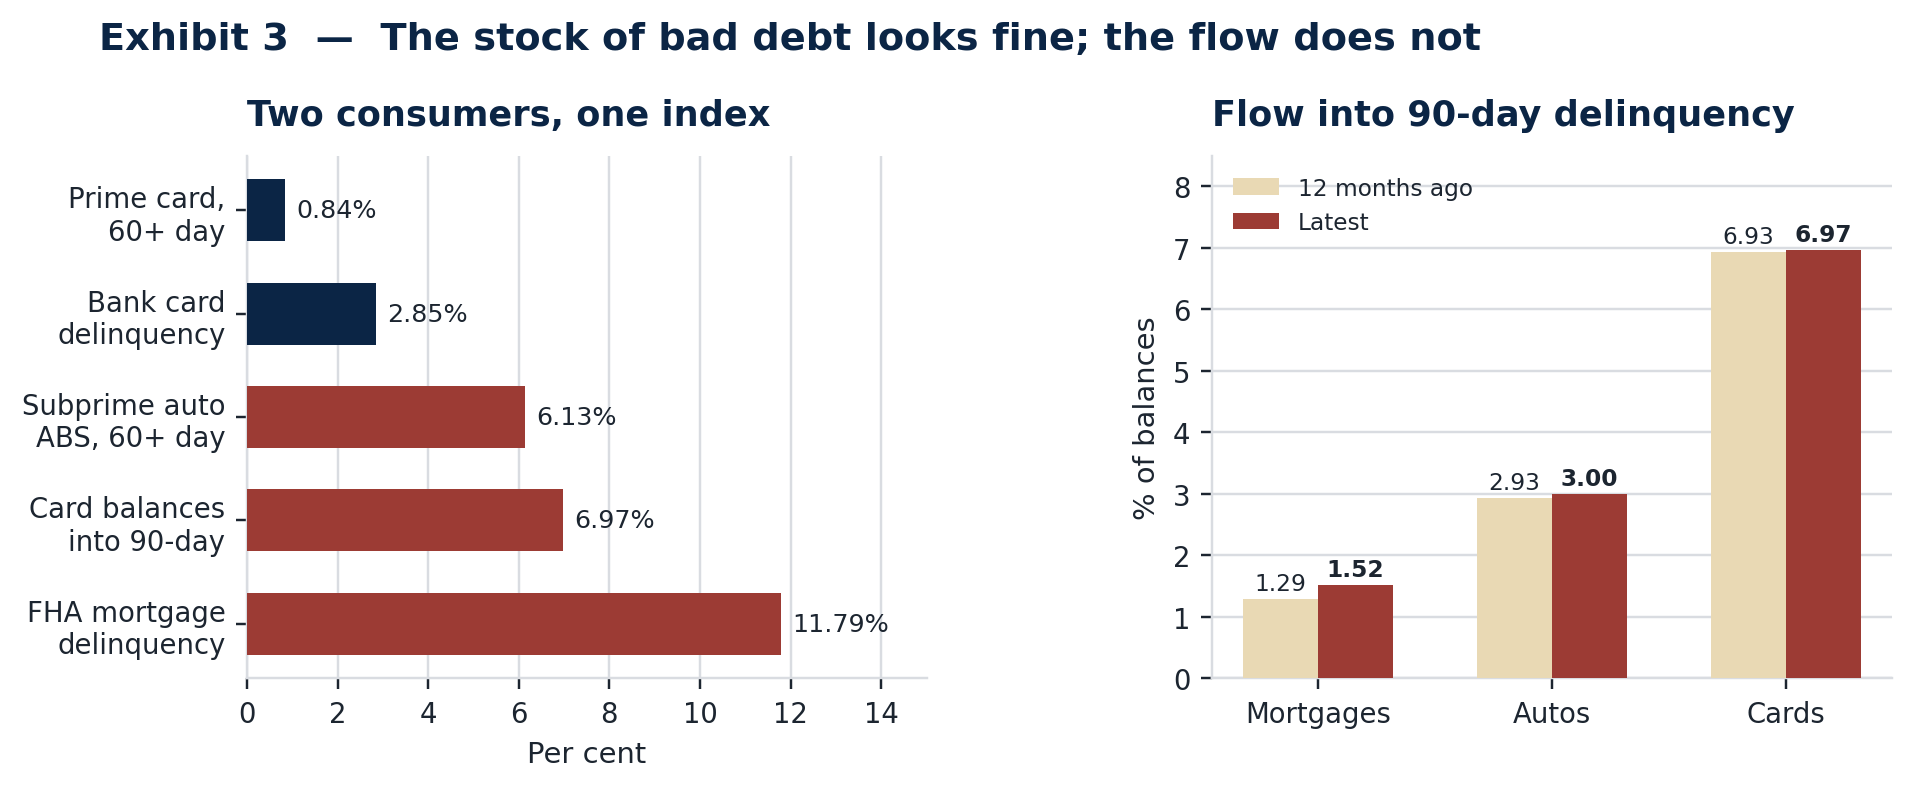
Exhibit 3. US consumer credit, latest available prints; flow panel compares balances transitioning into 90-day delinquency against twelve months earlier.
Elsewhere
The euro area's bad-debt stock looks fine (household NPLs 2.14%) but Stage 2 balances rose to 9.13% and the ECB reports tightening consumer-credit standards; rising collateral values (house prices +4.7% y/y, Portugal +17.8%) are propping up loss-given-default more than they reflect borrower resilience. The UK looks late-cycle: unsecured credit is growing 9.2% y/y (cards +12.5% at a 21.45% effective rate) even as arrears stay low for now, with lenders' own surveys pointing to deterioration landing in H1 2027 and motor-finance redress (£9.1bn, 12.1mn agreements) the largest bounded liability. China's household NPLs have grown over 20% to RMB2.22trn as short-term lending contracts 7% y/y and youth unemployment sits at 17.9% — households deleveraging into rising defaults. Japan is the most under-priced consumer rate risk globally: roughly 75% of new mortgages are still variable-rate against a three-decade-high policy rate of 1.00%, and about 40% of borrowers do not understand their own rate-reset terms. Across emerging markets, stress sits outside the regulated banking perimeter — Indian fintechs now hold 56.8% of small-ticket personal loans at 6.4% delinquency, and Brazilian household debt service (excluding mortgages) is a record 26.6% of income — while the Gulf remains the benign outlier, with Saudi NPLs at 0.9% and UAE at 2.3%.
3 Corporate Credit
The global picture
Headline default rates are genuinely falling. Moody's global speculative-grade rate was 4.4% on a trailing twelve-month basis in July (US 5.0%), with the agency expecting 3.2–3.7% by year-end, and S&P counted 62 global defaults year to date against 71 a year earlier. None of the three forces behind that improvement are comfortable, though. Distressed exchanges make up 44% of defaults — the event is being re-labelled, not avoided. The re-default rate has reached 45%, and prior liability-management exercises show over 80% re-defaulting within three years. And recoveries have collapsed: first-lien recoveries fell from a 77% average across 2008–22 to 61% across 2023–Q1 2026 and just 43% on 2025 vintages. Forward indicators read far less calm than backward-looking ones: Fitch's Market Concern Loan list is a record $273bn (17.2% of the US loan market), the loan distress ratio is 6.87% — near its 2022 peak — and there were 372 large US bankruptcies in the first half, a sixteen-year high. Rating drift is deteriorating beneath the surface too: fallen angels ($110bn) outpaced rising stars ($72bn) in the first quarter, and the BBB/BB cusp has widened to 34 issuers worth $62bn. Supply has been extraordinary — US investment-grade issuance is $1.46trn year to date including a record $145.2bn in August, with about $220bn of that hyperscaler and AI-related paper against roughly $70bn in all of 2025; Nvidia's five-year CDS has doubled since late May to around 81bp.
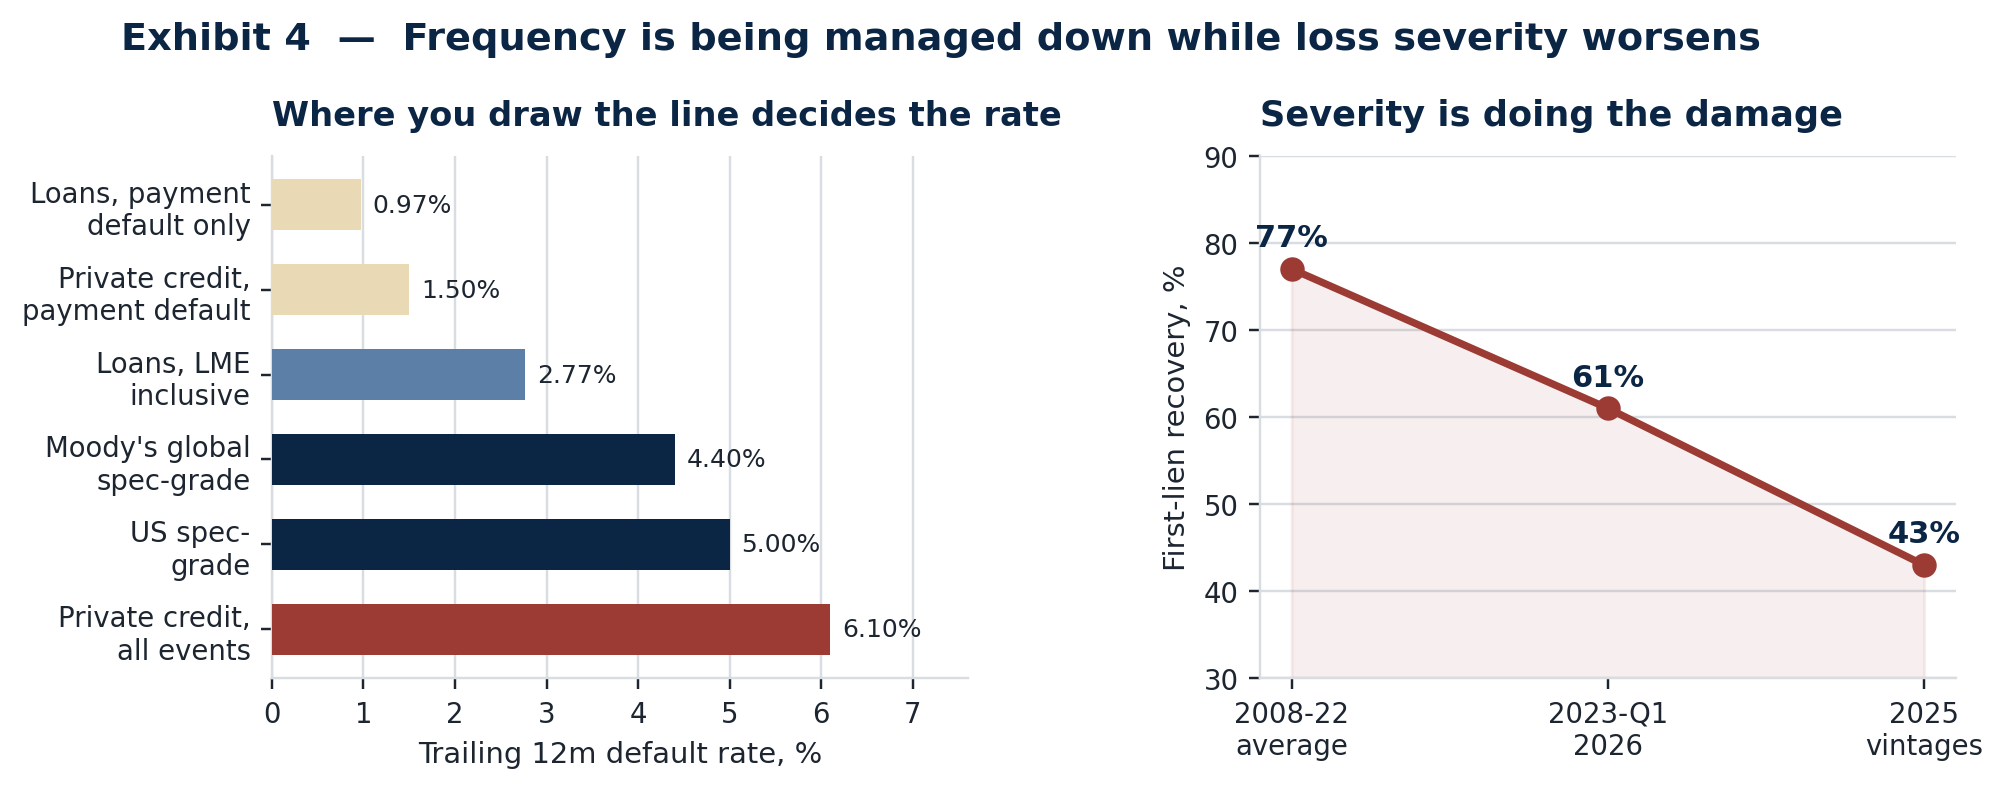
Exhibit 4. Left: trailing twelve-month default rates on different definitions. Right: first-lien recovery rates by vintage.
United States and abroad
US bank books remain sound outside commercial real estate — commercial and industrial delinquency is 1.27% with charge-offs at 0.58% — but Trepp CMBS delinquency hit 7.85% in August (office 12.00%) even as office vacancy improves, a maturity and valuation problem rather than a demand one. Middle-market fundamentals are eroding at the margin: EBITDA growth slowed from 27% to 24%, first-lien covenant headroom compressed from 0.46x to 0.28x of EBITDA, and loan yields at 8.21% now exceed high yield's 7.15%. In Europe, spreads (euro HY 260bp, IG roughly 79bp) sit near the bottom decile of their ten-year range — justified by flows, as insurers buy yield rather than spread, not by fundamentals, with insolvencies still grinding higher in Germany and France. China's corporate credit is stabilising at a low level (bank NPLs 1.51%, most LGFV hidden debt worked through), though property remains unresolved. Japan's roughly ¥3trn of net overseas bond sales this year is the largest such outflow since 2022 and the channel most likely to transmit a shock into US and euro IG spreads. Emerging markets ex-China look the most defensible pocket: EM high yield has returned 5.6% year to date against 0.0% for EM investment grade, with risk concentrated in idiosyncratic pockets — Brazilian judicial-recovery filings, Indian borrowing costs at a seven-year high — rather than anything systemic.
4 Private Credit, Loans and Structured Credit
US private credit has grown to roughly $1.4trn — now the same size as the leveraged loan market — but runs materially lower quality: about 5.0x leverage against 3.2x for syndicated loans, 2.2x interest coverage against 3.7x, and roughly 15% CCC-equivalent exposure against 9%, all on quarterly model marks. Fitch's private-credit default rate hit a record 6.1% against a payment-default rate of only about 1.5%; the gap is the cycle being deferred through extensions and payment-in-kind, which now makes up 58% of all PIK versus 2.5% in 2021. Dividend cuts have hit four of the last five months across listed BDCs, and sector price-to-NAV ranges 0.74x–0.85x. Pricing has not kept pace with the risk: the BDC spread pickup over syndicated loans has collapsed from over 300bp on 2017–18 vintages to under 100bp this year, thin compensation for 5.0x leverage and quarterly marks. Valuation dispersion is now well documented — an average five points on the same instrument across managers, with one borrower marked 27 points apart across three BDCs on the same date — making this a fiduciary question as much as a credit one. In loans, realised credit is improving (the LME-inclusive default rate is a three-year low of 2.77%) while the price signal worsens: loans priced below 90 have risen from 6.8% to 11.7% over twelve months, almost entirely in software, which bids 86.46 against 96.84 for the rest of the index. The July Serta ruling — participating lenders in a 2020 uptier held liable for roughly $400m — should make uptiers rarer and pro rata protections more valuable to hold.
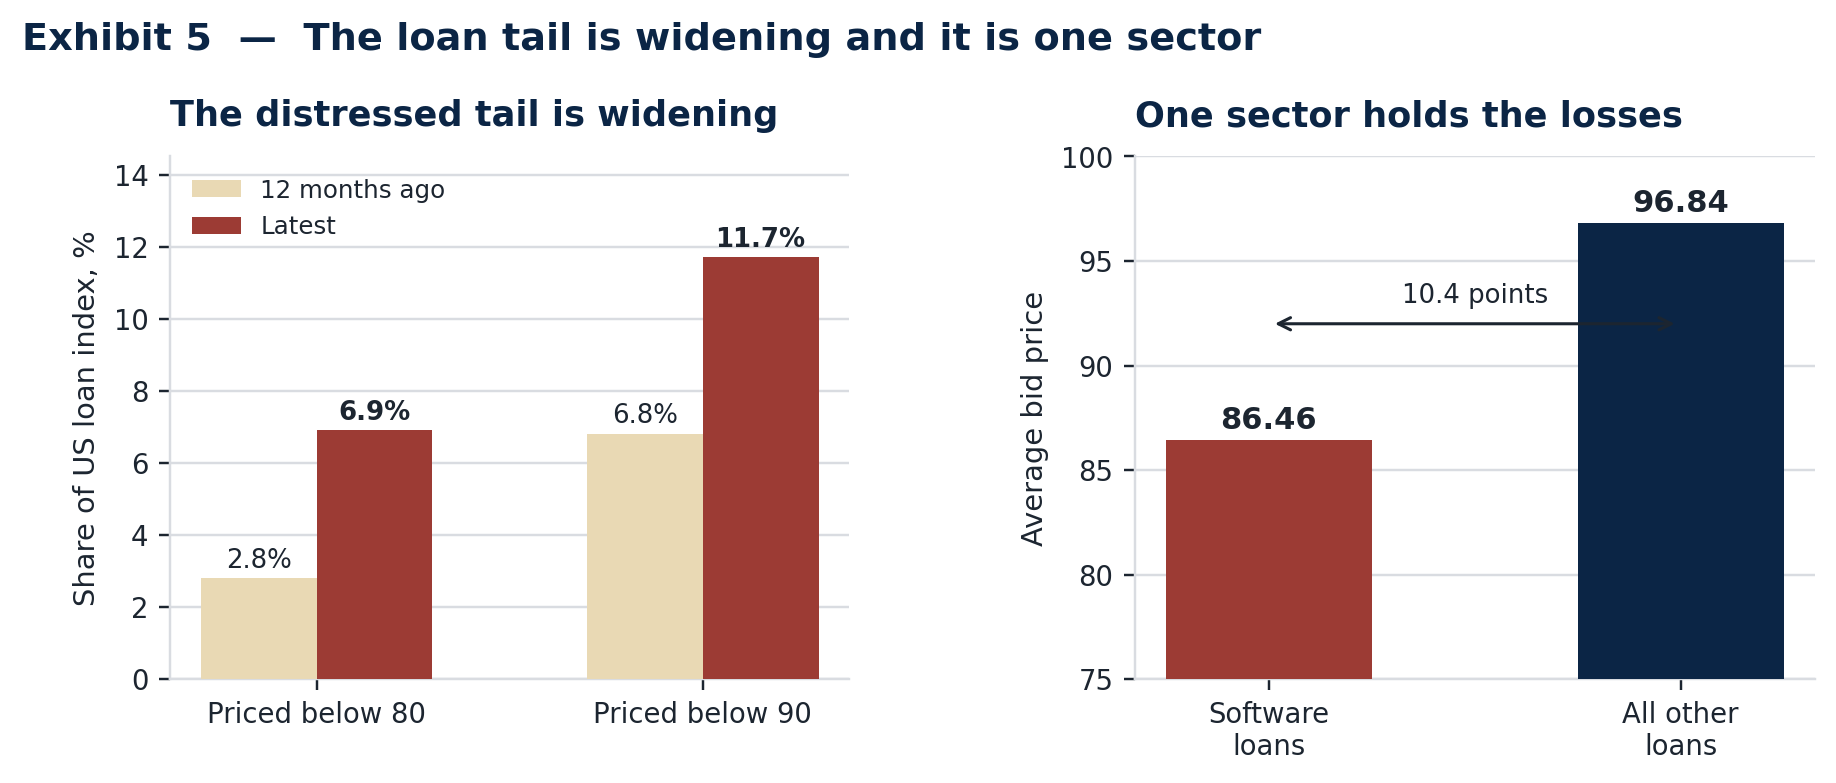
Exhibit 5. Left: share of the US leveraged loan index priced below 80 and below 90. Right: average bid price, software loans against the rest of the index.
CLO collateral quality is sound (CCC buckets at 4.1% against 7.5% limits), but issuance is 71% refinancing rather than new arbitrage, and a daily-redeemable CLO ETF complex above $30bn now sits on an asset that only trades by bilateral quote — an untested liquidity mismatch. Data-centre securitisation has reached $46bn cumulatively and is projected at $150bn by 2028; holding both software direct loans and data-centre ABS is being long the same AI factor twice, with opposite signs of conviction. This year's headline accidents — the MFS shortfall, First Brands' fabricated receivables, Tricolor — were collateral fraud rather than credit deterioration, which says more, not less, about underwriting standards in specialty finance.
5 What Would Change Our View
Three chains would move idiosyncratic loss toward something systemic. The redemption chain: a fourth straight quarter of double-digit BDC redemption requests exhausts the semi-liquid runway, forces sales below carrying value, and resets marks across BDC NAVs, NAV-loan LTVs and insurer capital together. The ETF chain: a rates or credit shock hits the CLO ETF complex, AAA spreads gap wider, and the marginal bid for loans disappears just as the sub-90 cohort sits at 11.7%. The funding chain: a fourth large collateral fraud prompts banks to cut warehouse and NAV facilities across specialty finance at once, turning today's roughly $2trn of non-bank exposure from a growth story into a funding squeeze. We would turn more constructive if the Fed holds its policy rate rather than delivering the hike currently priced for September, private credit's payment-default rate stays near 1.5%, and the software loan cohort finds a floor. Unemployment cuts both ways here: a move higher would raise consumer default risk directly, particularly at the subprime and government-insured margin, but it would also weaken the case for a hike in the first place — the same softening that hurts consumer credit quality is what keeps the Fed on hold.
6 Monitoring Dashboard


.png)